📷
画像処理100本ノックに挑戦|ヒストグラム表示(021/100)
これはなに?
画像処理100本ノックを、TypeScriptとlibvipsで挑戦してみる記事の21本目です。
前回
実装
お題
ヒストグラム正規化を実装せよ。
ヒストグラムは偏りを持っていることが伺える。 例えば、0に近い画素が多ければ画像は全体的に暗く、255に近い画素が多ければ画像は明るくなる。 ヒストグラムが局所的に偏っていることをダイナミックレンジが狭いなどと表現する。 そのため画像を人の目に見やすくするために、ヒストグラムを正規化したり平坦化したりなどの処理が必要である。
このヒストグラム正規化は濃度階調変換(gray-scale transformation) と呼ばれ、[c,d]の画素値を持つ画像を[a,b]のレンジに変換する場合は次式で実現できる。 今回はimori_dark.jpgを[0, 255]のレンジにそれぞれ変換する。
Coding
import sharp from 'sharp';

export async function histogramNormalization(
  inputPath: string,
  outputPath: string,
  targetMin: number = 0,
  targetMax: number = 255
): Promise<void> {
  try {
    const image = await sharp(inputPath)
      .raw()
      .toBuffer({ resolveWithObject: true });

    const { data, info } = image;
    const { width, height, channels } = info;

    // 元の最小値と最大値を取得
    let currentMin = data[0];
    let currentMax = data[0];
    for (let i = 0; i < data.length; i++) {
      if (data[i] < currentMin) currentMin = data[i];
      if (data[i] > currentMax) currentMax = data[i];
    }

    // 正規化前のヒストグラム表示
    console.log('\n正規化前のヒストグラム');
    displayHistogram(data);

    // スケーリング係数を計算
    const scale = (targetMax - targetMin) / (currentMax - currentMin);

    // 正規化の実行
    const normalizedData = Buffer.alloc(data.length);
    for (let i = 0; i < data.length; i++) {
      const normalized = scale * (data[i] - currentMin) + targetMin;
      normalizedData[i] = Math.min(255, Math.max(0, Math.round(normalized)));
    }

    // 結果を保存
    await sharp(normalizedData, {
      raw: {
        width,
        height,
        channels
      }
    })
    .toFile(outputPath);

    // 正規化後のヒストグラム表示
    console.log('\n正規化後のヒストグラム');
    displayHistogram(normalizedData);

    // 結果の表示
    console.log('\n正規化の結果:');
    console.log('正規化前の範囲:', { min: currentMin, max: currentMax });
    let normalizedMin = 255, normalizedMax = 0;
    for (let i = 0; i < normalizedData.length; i++) {
      if (normalizedData[i] < normalizedMin) normalizedMin = normalizedData[i];
      if (normalizedData[i] > normalizedMax) normalizedMax = normalizedData[i];
    }
    console.log('正規化後の範囲:', { min: normalizedMin, max: normalizedMax });
    console.log('\nヒストグラム正規化が完了しました');

  } catch (error) {
    console.error('画像処理中にエラーが発生しました:', error);
    throw error;
  }
}

function displayHistogram(data: Buffer) {
  // ヒストグラムデータの作成
  const histogram = new Array(256).fill(0);
  for (let i = 0; i < data.length; i++) {
    histogram[data[i]]++;
  }

  // ASCII表示のための設定
  const height = 20;
  const width = 80;
  const binSize = Math.ceil(256 / width);

  // 圧縮データの作成
  const compressedData: number[] = [];
  for (let i = 0; i < width; i++) {
    let sum = 0;
    const start = i * binSize;
    const end = Math.min(start + binSize, 256);
    for (let j = start; j < end; j++) {
      sum += histogram[j];
    }
    compressedData.push(sum);
  }

  const maxValue = Math.max(...compressedData);

  // ヒストグラム表示
  console.log('\nヒストグラム表示');
  console.log('=' . repeat(width + 2));

  for (let h = height - 1; h >= 0; h--) {
    process.stdout.write('|');
    for (let w = 0; w < width; w++) {
      const normalizedValue = compressedData[w] / maxValue;
      const threshold = h / height;
      process.stdout.write(normalizedValue > threshold ? '█' : ' ');
    }
    process.stdout.write('|\n');
  }

  console.log('=' . repeat(width + 2));
  console.log(`0${' '.repeat(width-2)}255`);

  // 統計情報
  const total = compressedData.reduce((a, b) => a + b, 0);
  const maxCount = Math.max(...histogram);
  console.log('\n統計情報:');
  console.log(`総ピクセル数: ${total}`);
  console.log(`最大出現回数: ${maxCount} (値: ${histogram.indexOf(maxCount)})`);
}
結果
| 入力 | 出力 |
|---|---|
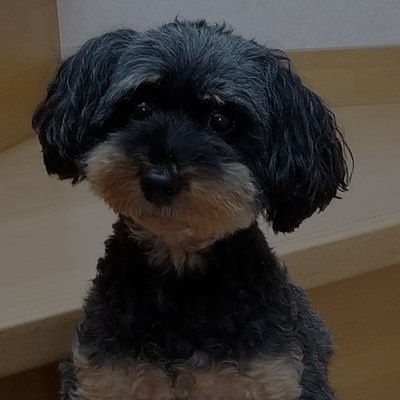 |
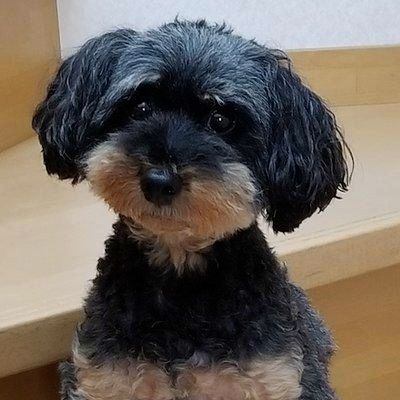 |
 |
 |
Discussion