データクオリティ系のツールre_data・re_cloud触ってみた
気にはなってるけど触ってないビッグデータ系のツール・サービスを触る Advent Calendar 2022の#8です。
re_dataとは
re_data is an open-source data reliability framework for modern data stack. 😊
だそうです。これだけだとなんのコッチャですが、dbtと連携し
- カラム毎のメトリクス(平均とかNULLの割合とか)の計測
- 異常検知
- dbtテストの履歴の保存
- それらをレポートするHTMLドキュメントの作成
などの(他にもいくつか機能はあります)を提供するツールです。dbtと連携する異常値検知という点では、Elementaryが近いカテゴリーの製品かと思います。
re_cloudとは
re_cloud enables you to store and collaborate on reports from different open-source and custom build data apps.
です。色々なデータ関係のプロダクト(「data apps」)のレポートを一箇所に集めるSaaS(現在オープンベータ)で、具体的には
DB/Query Engine
- BigQuery
- PostgreSQL
- Redshift
- Snowflake
- Trino
データクオリティ系のツール
- re_data
- dbt
- Great Expectations
その他
- Jupyter Notebook
のレポートを集め、Webブラウザ上で閲覧できるようにします。
なお、re_dataとre_cloudは(多分)別々のプロダクトで、どちらかだけを利用することも可能です。
re_data試してみる
re_dataがサンプルデータ・プロジェクトを提供してくれていますので、それを利用して
- 異常値検知
- dbtテスト(の結果の保存)
- HTMLドキュメントの作成
を行ってみます。
(Ubuntu20.04、WSL2(Windows 10)、Python 3.8、PostgreSQL15.1で確認)
準備
まずは、dbt・re_dataパッケージをインストールします。
pip install re_data
pip install dbt-postgres
サンプルプロジェクトの準備をします。サンプルプロジェクトはダミーデータやパッケージの設定、dbtのモデルなどを含んでおり、GitHubリポジトリでも参照できます。
re_data init toy_shop
cd toy_shop/
動作確認用のデータベースとして、PostgreSQLをコンテナで起動します。
(データベースの指定はre_dataのドキュメントには特に無い気がします。dbtが対応するデータベースならO.K.?)
docker-compose.yaml
version: '3.1'

services:
  db:
    image: postgres:15.1
    restart: always
    environment:
      POSTGRES_PASSWORD: admin
    ports:
      - 5433:5432
    volumes:
      - ./postgresql:/var/lib/postgresql/data

  # 動作確認用のツール。無くても動くはず
  adminer:
    image: adminer
    restart: always
    ports:
      - 8080:8080
コンテナの起動
mkdir postgresql
docker-compose up

# 接続確認を兼ねてデータベースの作成
psql -h 127.0.0.1 -p 5433 -U postgres -c 'CREATE DATABASE toy_shop'
dbtからPostgreSQLに接続する設定を~/.dbt/profiles.ymlに記載します。
toy_shop:
  target: dev
  outputs:
    dev:
      type: postgres
      host: localhost
      user: postgres
      password: admin
      port: 5433
      dbname: toy_shop
      schema: public
      threads: 1
      keepalives_idle: 0
      connect_timeout: 10
シードデータを流し、モデルを準備します
dbt seed
dbt run --select package:toy_shop

# シードデータが作成された確認
psql -h 127.0.0.1 -p 5433 -U postgres -d toy_shop -c '\d'
Password for user postgres:
           List of relations
 Schema |   Name    | Type  |  Owner
--------+-----------+-------+----------
 public | customers | table | postgres
 public | orders    | table | postgres
 public | pending_orders_per_customer | view  | postgres
メトリクスの計算と異常の検知
ここまでは準備の話でした。ここからre_dataの機能、まずは異常値検知を試してみます。
re_dataではdbtの各modelファイル、もしくはschema.yamlに
- モニタリングするか
- モニタリングするカラム
- 異常値検知の閾値
- メトリクスの計算に使うタイムスタンプ(NULLにするとテーブル全体)
などを設定します(サンプルプロジェクトの場合はmodelsディレクトリのSQLファイルと、seedディレクトリのschema.yaml)。
z-score・異常値の検出の具体的な実装が気になる方は、dbt-re-data/models/alerts/で実装されていますので参照してください。
メトリクスの計算・異常の検知にはre_data runコマンド(もしくはdbt run --models package:re_dataを実行します)
# dbt runコマンド
# dbt run --models package:re_data --vars {"re_data:time_window_start": "2021-01-10 00:00:00", "re_data:time_window_end": "2021-01-11 00:00:00"}
# のtime_window_start・time_window_endを変えて10日分するシンタックスシュガーです
re_data run --start-date 2021-01-01 --end-date 2021-01-11
このコマンド実行は、異常値があっても失敗扱いにはなりません。re_data runで計算されたメトリクスや、検出した異常値などはテーブルに保存されます。
# re_dataが使うテーブルがpublic_re(データのあるスキーマにサフィックスを付けたスキーマ)に追加されています
PGOPTIONS=--search_path=public_re psql -h 127.0.0.1 -p 5433 -U postgres -d toy_shop  -c '\d'
Password for user postgres:
                    List of relations
  Schema   |           Name            | Type  |  Owner
-----------+---------------------------+-------+----------
 public_re | re_data_alerts            | view  | postgres
 public_re | re_data_anomalies         | view  | postgres
 public_re | re_data_base_metrics      | table | postgres
 public_re | re_data_columns           | table | postgres
 public_re | re_data_columns_over_time | table | postgres
 public_re | re_data_last_metrics      | view  | postgres
 public_re | re_data_last_stats        | view  | postgres
 public_re | re_data_metrics           | view  | postgres
 public_re | re_data_monitored         | table | postgres
 public_re | re_data_schema_changes    | table | postgres
 public_re | re_data_selected          | view  | postgres
 public_re | re_data_table_samples     | table | postgres
 public_re | re_data_test_history      | table | postgres
 public_re | re_data_test_runs         | view  | postgres
 public_re | re_data_z_score           | table | postgres
(15 rows)
異常値とみなされた値を適当に見てみます。
PGOPTIONS=--search_path=public_re psql -h 127.0.0.1 -p 5433 -U postgres -d toy_shop  -c 'SELECT * FROM re_data_anomalies WHERE z_score_value = (SELECT max(z_score_value) FROM re_data_anomalies ) LIMIT 1'  | tee
Password for user postgres:
                id                |          table_name          | column_name |  metric  |   z_score_value    | modified_z_score_value |                anomaly_detector                |    last_value    |     last_avg      |    last_median     |    last_stddev     | last_median_absolute_deviation | last_mean_absolute_deviation |      last_iqr      | lower_bound | upper_bound | last_first_quartile | last_third_quartile |   time_window_end   | interval_length_sec |        computed_on         |                      message                      | last_value_text
----------------------------------+------------------------------+-------------+----------+--------------------+------------------------+------------------------------------------------+------------------+-------------------+--------------------+--------------------+--------------------------------+------------------------------+--------------------+-------------+-------------+---------------------+---------------------+---------------------+---------------------+----------------------------+---------------------------------------------------+-----------------
 517029db0be307109d0db83dcfe06395 | "toy_shop"."public"."orders" | amount      | variance | 2.2675063680623855 |      96.24324457865293 | {"name": "modified_z_score", "threshold": 3.5} | 5871092436.97479 | 1028768407.682052 | 230735930.73593077 | 2135528304.3507254 |              39529220.77922073 |           1383521151.2264965 | 61440200.880990356 |             |             |  200154363.18067896 |  261594564.06166932 | 2021-01-08 00:00:00 |               86400 | 2022-12-08 09:09:13.185348 | variance(amount) is 470.69% greater than average. | 5871092436.97
(1 row)
このre_data_anomaliesのレコードでは、
- ordersテーブルのamountカラムで
- 2021/01/08の分散が他の日よりも大きい(470%)
- この日付はtime_window_endなので、怪しいと言っているのは1/7 00:00~1/7 23:59です
と言っています。実際にデータ見ると(下)確かに1/7の分散が大きく、re_data runはそれっぽい結果になっていそうです。
 SELECT date, variance(amount) FROM (SELECT amount, date(time_created) date FROM orders) s GROUP BY date ORDER BY date;
    date    |      variance
------------+---------------------
 2021-01-01 |  176052631.57894737
 2021-01-02 |  252923976.60818713
 2021-01-03 |  213203463.20346320
 2021-01-04 |  270265151.51515152
 2021-01-05 |  230735930.73593074
 2021-01-06 |  187105263.15789474
 2021-01-07 | 5871092436.97478992
 2021-01-08 |  205166666.66666667
 2021-01-09 |  139473684.21052632
 2021-01-10 |  199000000.00000000
(10 rows)
テスト
dbtにはテスト機能があり、カラムのNULLチェックなどを行うことができます。dbtのテストにre_dataを組み合わせて使うと、dbt testの履歴を保存することができます。
dbt_project.ymlに保存の設定を追加して、
re_data:save_test_history: true
テストをいつも通り実行します(サンプルプロジェクトではnot nullなどがいくつか設定されています)。
dbt test --select package:toy_shop
re_dataがテーブルを作り、テスト結果を記録しています。
 SELECT * FROM re_data_test_history LIMIT 1;
        table_name       | column_name |                                test_name                                 | status |   execution_time    | message | failures_count | failures_json | failures_table | severity | compiled_sql |       run_at
------------------------+-------------+--------------------------------------------------------------------------+--------+---------------------+---------+----------------+---------------+----------------+----------+--------------+---------------------
 toy_shop.public.orders | status      | accepted_values_orders_status__PENDING_PAYMENT__PAID__SHIPPED__DELIVERED | Pass   | 0.06573152542114258 |         |              0 |               |                | ERROR    |              | 2022-12-08 10:38:22
(1 row)
HTMLドキュメント化
ここでまでは、異常値検知・テストの結果をデータベースを見て確認していました。データベース見るのはおそらく例外的な手段で、re_dataにはハイカラなHTTMLドキュメントを作成する機能もあり、そちらで各種結果を確認することができます。
# HTMLドキュメントの作成。 target/index.htmlに出力されるはず
re_data overview generate --start-date 2021-01-01 --interval days:1
# HTTMLドキュメント閲覧のためのWebサーバーの起動
re_data overview serve
テスト結果(右上のセレクトボックスで過去の実行を選択できます)

異常検知

re_cloud
- アカウント登録
- APIキーの設定
- アップロード
をドキュメントに従い行うと、re_data(や他の連携システムのレポート)をアップロードすることが出来ました。
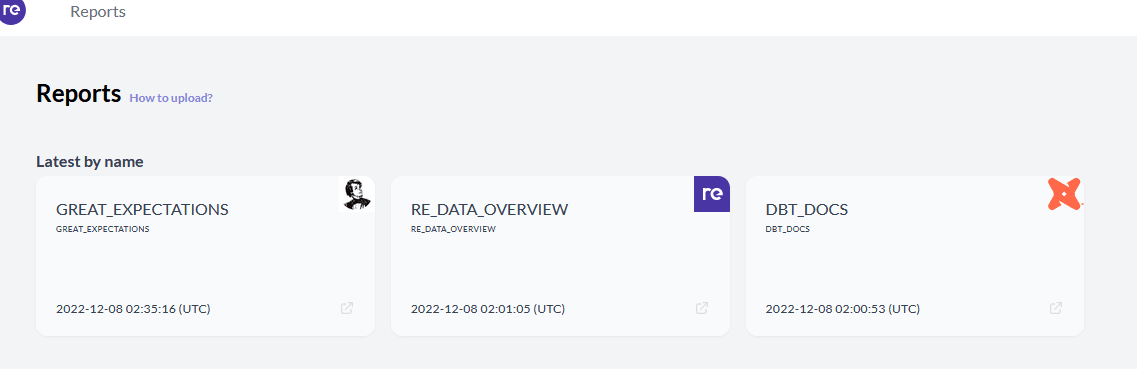
トップ画面
Great Expectationのドキュメント

Discussion