Open6
【途中】cloudwatch alermとECSで遊ぶ
ドキュメントはこのあたり
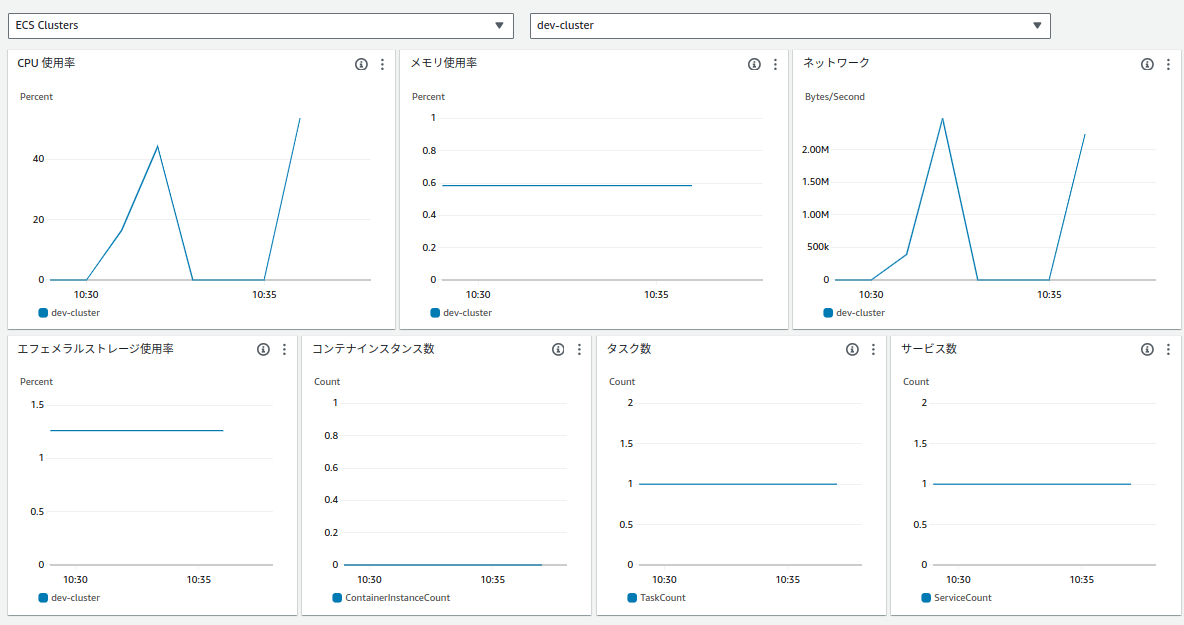
ECSのCPU監視をする
それにあたりクラスタでContainerInsightsを有効にして見れるようにしておく
コンテナはnginxが動作するようにしておく
ECSのCPU監視をする①
アラームはこんな感じ
alerms.tf
resource "aws_cloudwatch_metric_alarm" "main" {
  alarm_name                = "ecs-cpu-utilization-high"
  comparison_operator       = "GreaterThanThreshold"
  evaluation_periods        = "1"
  metric_name               = "CPUUtilization"
  namespace                 = "AWS/ECS"
  period                    = "60"
  statistic                 = "Average"
  threshold                 = "30"
  alarm_description         = "This alarm fires when CPU utilization exceeds 30%"
  insufficient_data_actions = []

  dimensions = {
    ClusterName = aws_ecs_cluster.cluster.name
    ServiceName = aws_ecs_service.service.name
  }

  actions_enabled = true
  alarm_actions = [
    var.sns_topic_arn
  ]
}
SNSトピックポリシーもcloudwatchからのアクセスを受けられるようにして
sns.tf
resource "aws_sns_topic_policy" "sns_topic_policy" {
  arn = aws_sns_topic.chatbot.arn

  policy = jsonencode({
    Version = "2012-10-17",
    Statement = [
      {
        Effect = "Allow",
        Principal = {
          Service = [
            "events.amazonaws.com",
            "cloudwatch.amazonaws.com" ######
          ]
        },
        Action   = "sns:Publish",
        Resource = aws_sns_topic.chatbot.arn
      },
    ]
  })
}
abで負荷をかけると
ab -n 200000 http://<ecsタスク>/
この通り
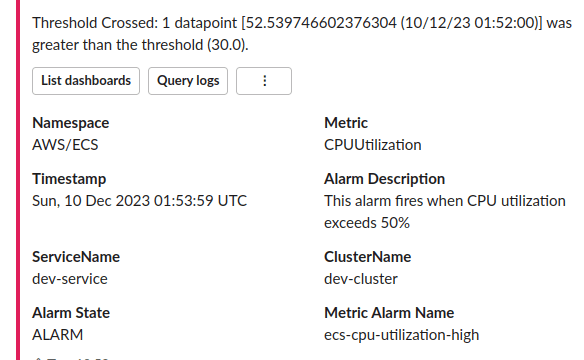
データポイントは1つ、periodは60なので、1分の間にどこかでCPUがしきい値を越せば発砲
このように評価期間を2にすると、1分間CPUがスパイクした場合でも検知しなくなる
評価期間の調整で検知を柔軟に監視可能
alert.tf
resource "aws_cloudwatch_metric_alarm" "main" {
-  evaluation_periods        = "1"
+  evaluation_periods        = "2"
  period                    = "60"
abを3分間投げればこちらも検知するようになる
ab -t 180 -c 10 -n 10000000 http://<ECSタスク>/
mermaidのガントチャートでcloudwatch alermを視覚化できそう
ありがとうchatgpt、なんとかさまになってそう(内容はいずれ調べる)
mermaidの内容
gantt
    title CloudWatch Alarmの動作 (15:00からのシナリオ)
    dateFormat  HH-mm
    axisFormat %H:%M

    section CPU使用率
    CPU          :active, 15-00, 10m
    50%を超える          :active, 15-00, 15-02
    50%以下に下がる      :done, 15-02, 15-05

    section アラーム状態
    ALARM条件の評価     :crit, 15-00, 15-02
    ALARM状態           :crit, 15-02, 15-05
    OK条件の評価        :15-03, 15-05
    OK状態              :15-05, 15-06
ECSのCPUをもとにタスクをスケーリングする
resource "aws_appautoscaling_target" "ecs_target" {
  max_capacity       = 2
  min_capacity       = 1
  resource_id        = "service/${aws_ecs_cluster.cluster.name}/${aws_ecs_service.service.name}"
  scalable_dimension = "ecs:service:DesiredCount"
  service_namespace  = "ecs"
}

resource "aws_appautoscaling_policy" "ecs_policy" {
  name               = "scale-up"
  policy_type        = "TargetTrackingScaling"
  resource_id        = aws_appautoscaling_target.ecs_target.resource_id
  scalable_dimension = aws_appautoscaling_target.ecs_target.scalable_dimension
  service_namespace  = aws_appautoscaling_target.ecs_target.service_namespace

  target_tracking_scaling_policy_configuration {
    target_value       = 70
    predefined_metric_specification {
      predefined_metric_type = "ECSServiceAverageCPUUtilization"
    }
  }
}

resource "aws_cloudwatch_metric_alarm" "main" {

  actions_enabled = true
  alarm_actions = [
    var.sns_topic_arn,
    aws_appautoscaling_policy.ecs_policy.arn
  ]
  ok_actions = [
    var.sns_topic_arn
  ]
}