📋
KaggleのNLPコンペで初手に使える可視化 〜BERTopicを用いた文書クラスタリングと可視化〜
BERTopic は、Transformersを用いて文書のトピックモデリングを行うためのPythonライブラリです。本記事では、自分がKaggleコンペの初手EDAによく使うコードをまとめました。
入出力のイメージ
入力: 文章のリスト
(例:["I am sure some bashers of Pens fans ...", "My brother is in the market for a high-performance video card that supports VESA local bus with 1-2MB RAM. Does anyone hav...", ...])
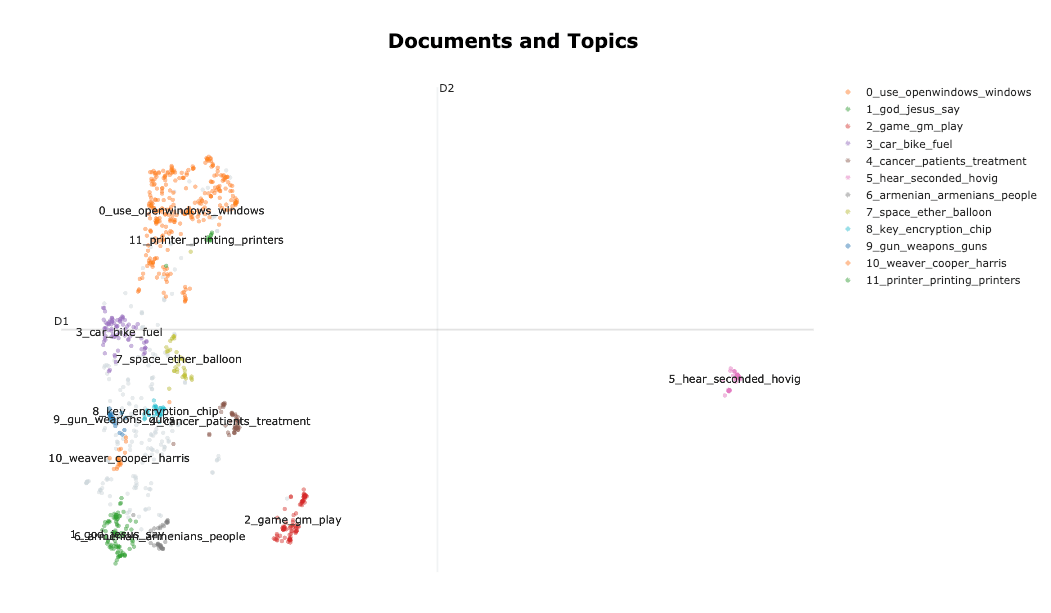
出力: 各文書の関係性を表した2次元座標図
ソースコード
- 以下にもあります
import pandas as pd
from umap import UMAP
from bertopic import BERTopic
from IPython.display import display
from sklearn.datasets import fetch_20newsgroups
from sklearn.feature_extraction.text import CountVectorizer

# データの取得
# scikit learnに元から入っているnewsのデータを使用
# https://scikit-learn.org/stable/modules/generated/sklearn.datasets.fetch_20newsgroups.html
docs_dict = fetch_20newsgroups(subset='all', remove=('headers', 'footers', 'quotes'))

# Pandas DataFrameへ変換
df_docs = pd.DataFrame({
    "data": docs_dict["data"],
    "target": docs_dict["target"]
})
df_docs["num words"] = [len(data.split(" ")) for data in df_docs["data"]]

print("Num words stats")
print(df_docs["num words"].mean(), df_docs["num words"].median())

# 2件だけデータを見てみる
# print("## DataExample")
# print("```")
# for i in [0, 1]:
#     print(df_docs.loc[i, "data"])
#     print("---")
# print("```")

# 計算量的な問題により、1000件のみに絞る
df_docs = df_docs.sample(1000, random_state=0)

# BERTopicによるクラスタリング
# 結果を固定したい場合は umapのrandom_stateを0にして固定
umap_model = UMAP(n_neighbors=15, n_components=5, min_dist=0.0, metric='cosine', random_state=0)

# 各Topicの代表的なワードを絞る際にStopwordsを除く
vectorizer_model = CountVectorizer(stop_words="english")

# BERTopicモデルの規定
topic_model = BERTopic(
    representation_model="thenlper/gte-base", # 日本語ならば "intfloat/multilingual-e5-base" などが候補になる
    umap_model=umap_model,
    vectorizer_model=vectorizer_model
)

# topicやprobabilityの計算
topics, probs = topic_model.fit_transform(df_docs["data"])

df_docs["topic_predicted"] = topics
display(df_docs)

# 各Topicの概要
display(topic_model.get_topic_info())

# 各dataの可視化
topic_model.visualize_documents(df_docs["data"].values)
結果
各トピックの分析
各トピックの分析結果を示します。クラスタ -1 はその他のようなのですが、ここに maxaxaxax... という明らかに除外した方が良さそうな文字列とかが見つかります。。

可視化
次に、可視化の結果を記載します。クラスタ5が結構離れていることなどがわかりますね。また、notebookを動かすとわかりますが、plotlyの図で実際にデータに触ることもできます。
Tips
BERTopicのFAQに多くのTipsが載っています
日本語への対応
埋め込みモデルを日本語対応したものにすることで日本語も対応できます。
topic_model = BERTopic(
    representation_model="intfloat/multilingual-e5-base",
)
結果の固定
UMAPの乱数を固定しないと結果が固定化されません。下記のコードの random_state 以外の変数はBERTopicのデフォルトを使用しています。
from umap import UMAP

# 結果を固定したい場合は umapのrandom_stateを0にして固定
umap_model = UMAP(n_neighbors=15, n_components=5, min_dist=0.0, metric='cosine', random_state=0)

# BERTopicモデルの規定
topic_model = BERTopic(
    representation_model="thenlper/gte-base",
    umap_model=umap_model,
)
処理の手順について
以下に記載あり。埋め込み => UMAPで次元削減 => HDBScanでクラスタリングという流れ。
Discussion