論文に使えるヒートマップをPythonのSeabornで描きたい!
はじめに
こんな感じのヒートマップを描きたい!ということで諸々調整してみました。目次に「やりたいこと」が書いてあるので、そこから見てってください。

https://www.nature.com/articles/s41598-018-38216-9 のFigure4より
ソースコードについて
以下で公開しています。
環境は以下の通り。
Python 3.10.11
Seaborn Version:  0.12.2
Scipy Version:  1.10.1
前準備
必要なライブラリと今回使用する仮想データ生成を行います。
import scipy
import itertools
import numpy as np
import pandas as pd
import seaborn as sns
import scipy.stats as st
import matplotlib.pylab as plt
from collections import defaultdict

# データ生成
# 自身で使用したいデータがある場合はここは不要です。

# 乱数のシード値を指定する
np.random.seed(123)

# データの生成
n = 100
x1 = np.random.normal(size=n)
x2 = np.random.normal(size=n)
x3 = np.random.normal(size=n)

# 相関係数を持つ変数を作成する
x4 = 0.5 * x1 + 0.5 * x2 + np.random.normal(scale=0.1, size=n)
x5 = -0.2 * x2 + 0.8 * x3 + np.random.normal(scale=0.1, size=n)
x6 = 0.7 * x1 - 0.7 * x2 + np.random.normal(scale=0.1, size=n)

# データフレームの作成
df = pd.DataFrame({'x1': x1, 'x2': x2, 'x3': x3, 'x4': x4, 'x5': x5, 'x6': x6})

# データをCSVファイルに保存する
df.to_csv('data.csv', index=False)

# データの読み込み
df = pd.read_csv('data.csv')

# 今回可視化するデータフレームの作成
df_corr = df.corr("spearman")

# 今回可視化するDataFrameについて
# 小数点3桁まで表示に変更
pd.options.display.float_format = '{:.3f}'.format

# display
df_corr
【出力】

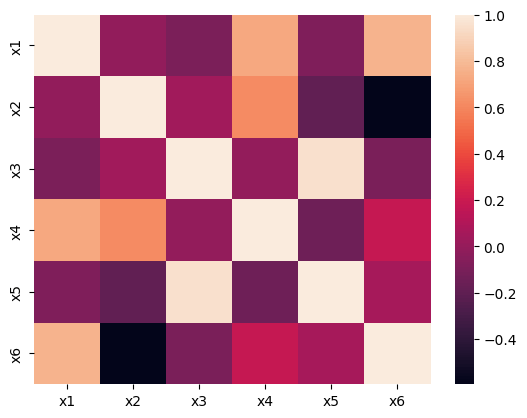
1. シンプルなヒートマップ
sns.heatmap(
    df_corr
)
【出力】
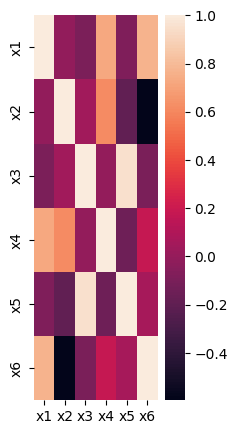
2. 縦横比の修正
matplotlibの機能での修正が一番柔軟です。plt.figure(figsize=(num, num)) で調整することができます。
# 縦長に変更してみる
plt.figure(figsize=(2, 5))
sns.heatmap(
    df_corr,
)
【出力】
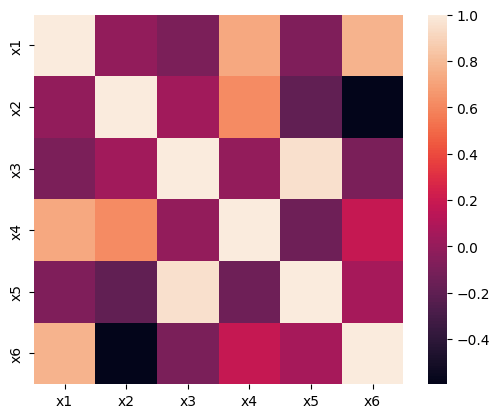
sns.heatmap内で square=True で出力することもできます。
# heatmap部分を正方形に
sns.heatmap(
    df_corr,
    square=True
)
【出力】
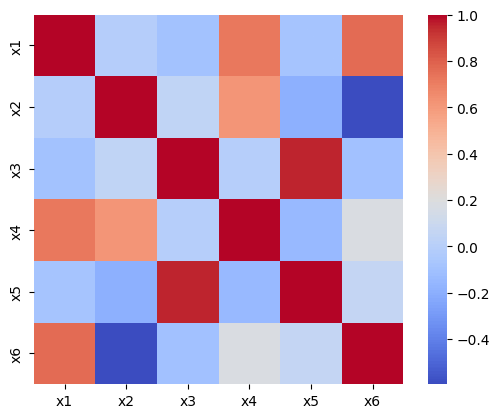
3. ヒートマップの色合いを変えたい
cmap で変更可能。 cmap='bwr' か cmap='coolwarm'が論文でよく見る赤青系のカラーマップ。 以降の絵では coolwarm を使っていきます。
sns.heatmap(
    df_corr,
    cmap="bwr",
    square=True
)

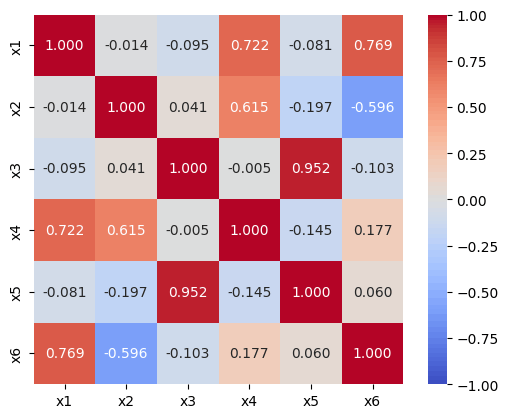
4. ヒートマップの最大値、最小値を設定したい
vmax, vmin で設定できます。
sns.heatmap(
    df_corr,
    cmap="coolwarm",
    square=True,
    vmax=1.0,
    vmin=-1.0
)
【出力】

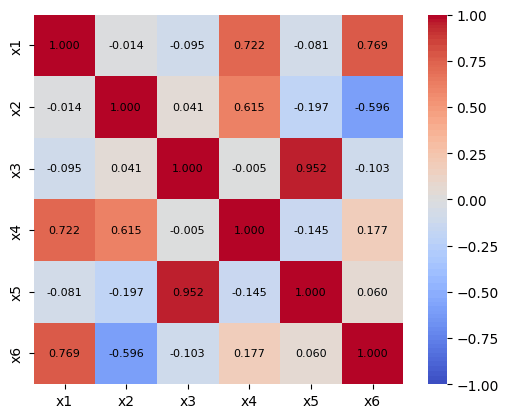
5. 値をラベルしたい
annot=True でラベルできます。表示桁数のフォーマットは fmt で設定する。
# 今回は小数点3桁まで表示
sns.heatmap(
    df_corr,
    cmap="coolwarm",
    square=True,
    vmax=1.0,
    vmin=-1.0,
    annot=True,
    fmt=".3f"
)
6. 値をラベルする際、文字のサイズや色を変えたい
annot_kws で諸々変更できます。今回は色を黒に、fontsizeを小さく(8に)してみます。
参考: https://stackoverflow.com/questions/72168450/changing-annotation-text-color-in-seaborn-heat-map
# 今回は小数点3桁まで表示
# 色をblackに, fontsizeを8に変更
sns.heatmap(
    df_corr,
    cmap="coolwarm",
    square=True,
    vmax=1.0,
    vmin=-1.0,
    annot=True,
    fmt=".3f",
    annot_kws={'fontsize': 8, 'color':'black'}
)
【出力】
7. 文字(有意な相関かどうか)をラベルしたい!
annot に文字を入れ、 fmt="" とすることで文字もラベルできます。
# 今回、同じ列同士の比較においては米印をつけないようにしています
dd = defaultdict(lambda: defaultdict(int))
for col1, col2 in itertools.combinations(df.columns, 2):
  pval = st.spearmanr(df[col1], df[col2]).pvalue
  if pval >= 0.05:
    value = ""
  if pval < 0.05:
    value = "*"
  if pval < 0.01:
    value = "**"
  if pval < 0.001:
    value = "***"
  dd[col1][col2] = value
  dd[col2][col1] = value
  dd[col1][col1] = ""
  dd[col2][col2] = ""
df_pval = pd.DataFrame(dd)
df_pval = df_pval.loc[df.columns, df.columns]

sns.heatmap(
    df_corr,
    cmap="coolwarm",
    square=True,
    vmax=1.0,
    vmin=-1.0,
    annot=df_pval,
    fmt="",
)
(df_pvalの中身)
【出力】

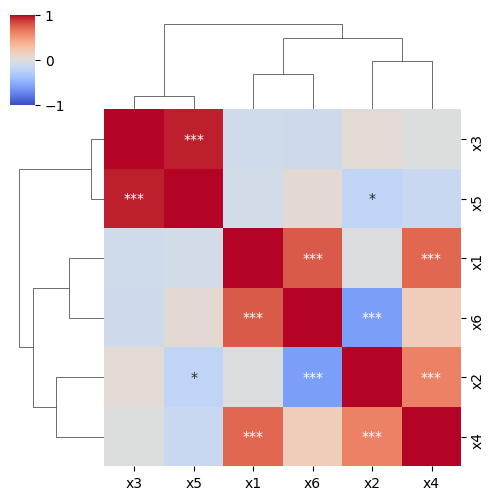
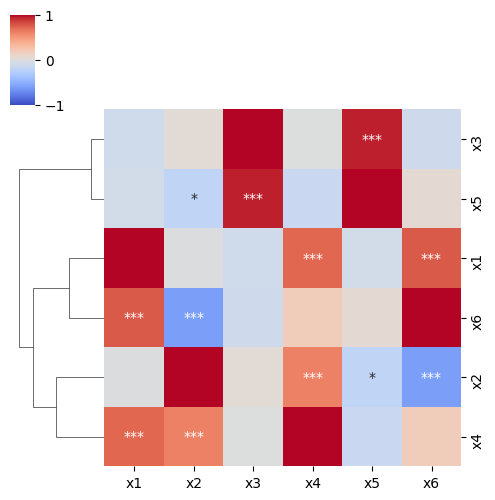
8. 行や列の値でクラスタリングしたい
sns.clustermap() を使用することになります
sns.clustermap(
    df_corr,
    cmap="coolwarm",
    vmax=1.0,
    vmin=-1.0,
    annot=df_pval,
    fmt="",
    figsize=(5, 5) # heatmapではこのオプション使用できないので注意
)
【出力】
8.1 行や列のクラスタリングした順番を抽出したい
ちなみに、文字が小さすぎて省略されることがよくあると思います。文字サイズを sns.set(font_scale=0.5) などで小さくするか、 sns.clustermapの帰り値の.dendrogram_row.reordered_indや .dendrogram_col.reordered_indで取得することができます。
参考:以下のNotesに記載があった
h = sns.clustermap(
    df_corr,
    cmap="coolwarm",
    vmax=1.0,
    vmin=-1.0,
    figsize=(5, 5) # heatmapではこのオプション使用できないので注意
)
print(df_corr.index[h.dendrogram_row.reordered_ind]) # => Index(['x3', 'x5', 'x1', 'x6', 'x2', 'x4'], dtype='object')
print(df_corr.columns[h.dendrogram_col.reordered_ind]) # => Index(['x3', 'x5', 'x1', 'x6', 'x2', 'x4'], dtype='object')
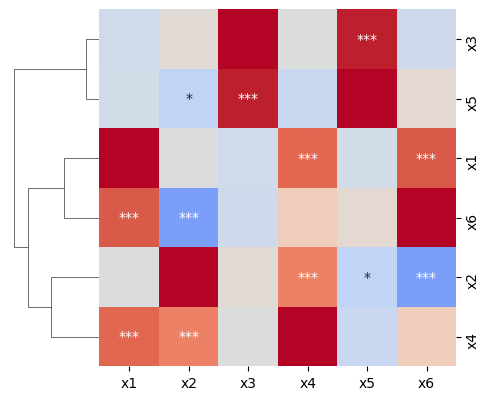
9. 行(or列)だけクラスタリングしたい
行: row_cluster=False, 列: col_cluster=False でクラスタリングしなくなります。
sns.clustermap(
    df_corr,
    cmap="coolwarm",
    vmax=1.0,
    vmin=-1.0,
    annot=df_pval,
    fmt="",
    figsize=(5, 5),
    col_cluster=False,
)
10. 行や列の値でクラスタリングを行い、かつ凡例は削除したい
sns.clustermap() は比較的クセのある関数で、あまり細かい編集には向きません。 ここでは、以下のGithubのissueを参考に、凡例の削除を行いたいと思います。
cm = sns.clustermap(
    df_corr,
    cmap="coolwarm",
    vmax=1,
    vmin=-1,
    annot=df_pval,
    fmt="",
    figsize=(5, 5),
    col_cluster=False,
)

# 凡例の削除
cm.cax.set_visible(False)

# 謎余白ができるので謎余白の削除
cm.ax_col_dendrogram.set_visible(False)
Discussion