😎
matplotlib で大きさの異なるグラフを作成する
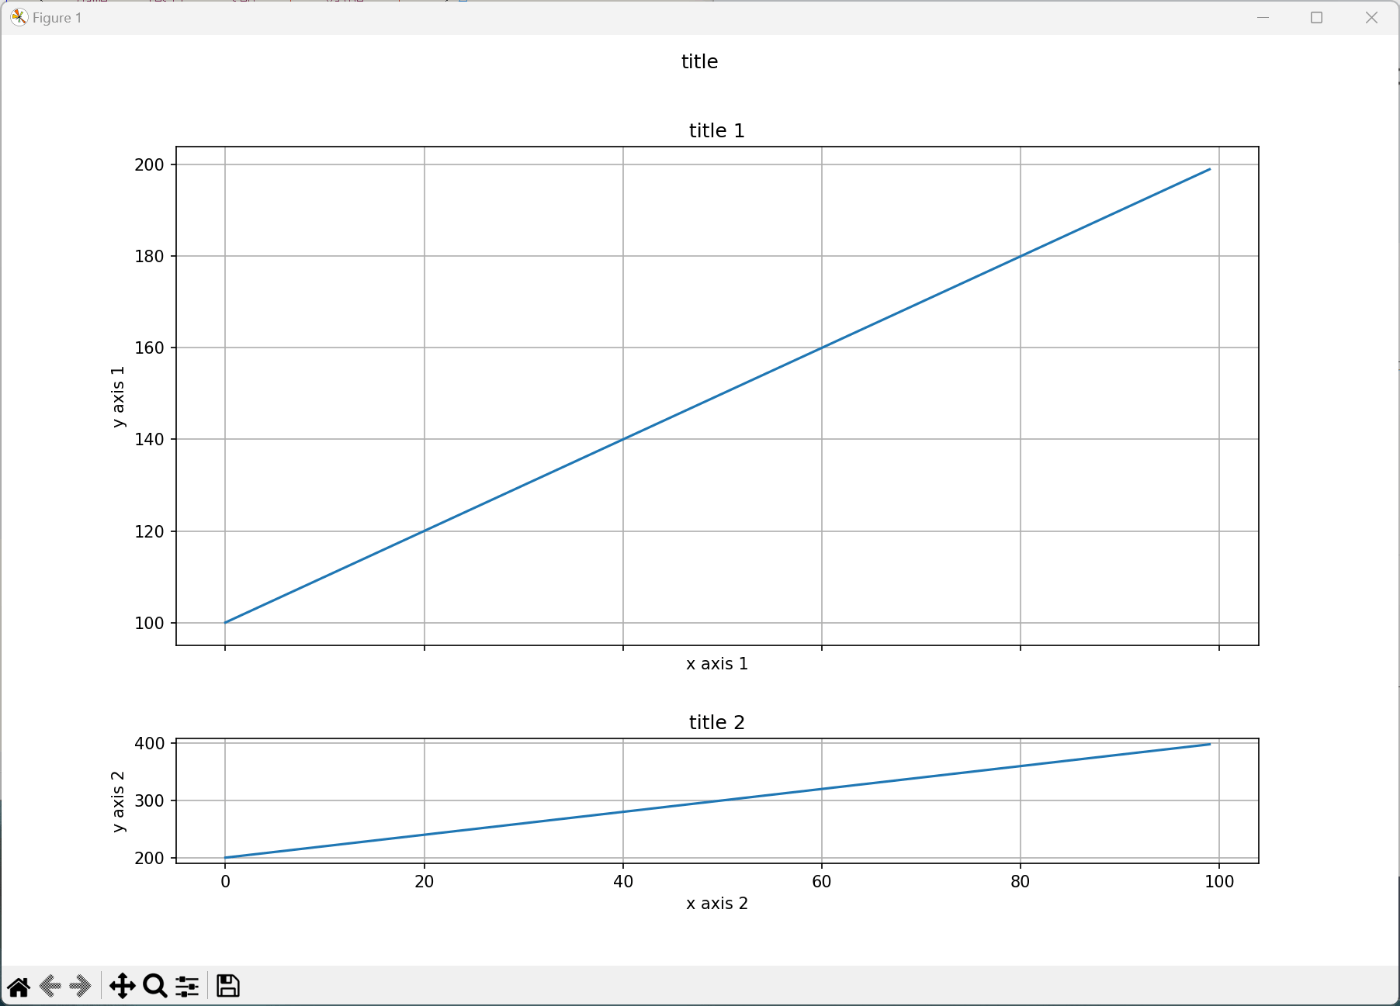
matplotlib で subplot で複数のグラフを作成するときに、各グラフの相対的な大きさを指定する。
サンプルコード
- nrows で縦の個数を指定する。
- ncols で横の個数を指定する。
- グラフの x軸の大きさの比を width_ratios で横の個数分配列で指定する。
- グラフの y軸の大きさの比を height_ratios で縦の個数分配列で指定する。
- wspace で横のグラフ間隔を調整する。(この例のように横の個数が 1 の場合不要)
- hspace で縦のグラフ間隔を調整する。
import matplotlib.pyplot as plt
import numpy as np

fig, axes = plt.subplots(
    nrows=2, # 縦
    ncols=1, # 横
    width_ratios=[1],
    height_ratios=[4, 1], # subplot の高さ比 (ここがやりたいこと)
    gridspec_kw={'wspace': 0.1, 'hspace': 0.3},
    sharex='col',
    sharey='row',
    figsize=(12, 8)
)
fig.suptitle("title")

for i, ax in enumerate(axes):
    j = i + 1
    x = np.arange(100)
    y = np.arange(100, 200) * j

    ax.grid()
    ax.plot(x, y)
    ax.set_title(f"title {j}")
    ax.set_xlabel(f"x axis {j}")
    ax.set_ylabel(f"y axis {j}")

plt.show()
表示例

参考リンク
- https://matplotlib.org/stable/api/_as_gen/matplotlib.pyplot.subplots.html
- https://qiita.com/MtNouchi/items/7818ed83e825938cdcae
- https://pystyle.info/matplotlib-sharex-sharey/
- https://qiita.com/nkay/items/d1eb91e33b9d6469ef51
- https://qiita.com/ultimatile/items/bc76104a17e05b8d9388
- https://matplotlib.org/3.3.0/api/_as_gen/matplotlib.pyplot.subplots_adjust.html
Discussion