はじめに
業務でDatadogを使う必要があるのだが、全くの初心者であり、早急にキャッチアップする必要があった。そこで、Datadog Learning Centerというサービスを利用して、Datadogの基本操作を学ぶことにした。本記事では、Datadog Learning Centerを利用して学んだことをまとめる。
モチベーション
- Datadogのコンセプトを理解したい
- Datadogの基本操作を学びたい
モチベーションは2点である。
Datadog Learning Centerとは
Learn by coding on real cloud compute instances on our free interactive platform. Confidently monitor, scale, and secure your applications whether you're a beginner or an experienced developer, an operations pro, or a security expert.
つまり、Datadogの機能をハンズオンで学べるサービスである。もちろん無料。現在、54のコースが提供されている。
まずは、人気コースから取り組めばいいだろうということで、内容をざっと確認する。

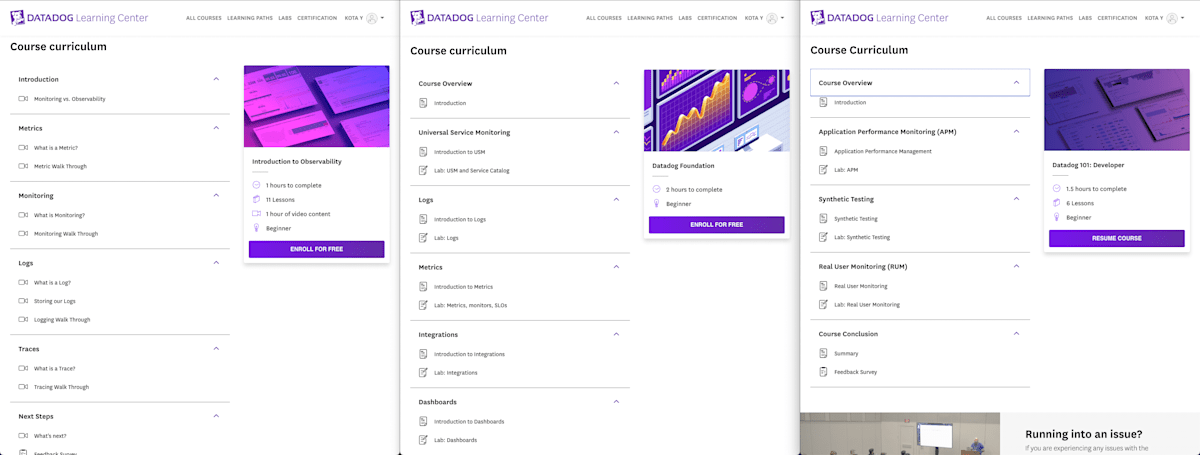
re.https://learn.datadoghq.com/courses/introduction-to-observability, https://learn.datadoghq.com/courses/datadog-foundation, https://learn.datadoghq.com/courses/dd-101-dev
- Introduction to Observability
- 座学
- Datadog Foundation
- ハンズオン(SRE寄り)
- Datadog 101: Developer
- ハンズオン(バックエンドエンジニア寄り)
という印象を受けた。上から順に進めていくのが良さそうである。
本記事では、Introduction to ObservabilityとDatadog Foundationについてまとめる。
(Datadog 101: Developerについては、今後の課題とする。)
Introduction to Observability
ここでは、Datadogでは何ができるのか、また、Observability、Monitoring、Metrics、Traces、Logsとは何か、なぜ必要なのか、といった基本的な概念が説明されている。
| 概念 | 説明 |
|---|---|
| Metrics | システムの状態を定量的な情報として表現/点で捉えるイメージ |
| Traces | リクエストの経路と処理時間に関する情報/線で捉えるイメージ |
| Logs | タイムスタンプ付きのシステムに関する情報 |
| Observability | 収集した情報から何が起こっているか、なぜ起こっているかを理解すること |
| Monitoring | システムの状態を理解するための情報を収集すること(Observabilityの一部) |
文字だとイメージしにくいが、以下の図がわかりやすい。

ref. https://www.macnica.co.jp/en/business/security/manufacturers/splunk/blog_20230515.html
DatadogはMetricsの収集から、Traces、Logsの収集もおこなってくれるオールインワンのObservabilityツールである。Datadogを用いると、これらを以下のように可視化できる。

まとめると、
- Metrics→what
- Traces→where
- Logs→why
であり、これらはObservabilityの重要は3大要素であるということ。そして、Datadogを用いることで、これらを可視化できるということ。
Datadog Foundation
Observabilityのコンセプトを理解したところで、次はDatadogの基本操作に入る。
- Describe the three different types of integrations
- Understand the benefits of Universal Service Monitoring (USM) and Service Catalog
- Search, filter, and query logs in the Log Explorer
- Create a custom facet and a saved view
- Visualize field aggregations
- Search for metrics in the Metric Summary page
- Graph metrics in the Metrics Explorer
- Create a metric-based monitor
- Create a monitor-based service level objective (SLO)
- Clone an existing dashboard
- Create a new dashboard
- Copy widgets from dashboards
- Add and configure new widgets
上記の内容が学べるものになっている。
Universal Service Monitoring
Universal Service Monitoring (USM)とは、Datadogの機能の一つで、監視対象のサービスのコードを変更することなく、サービス全体の監視を行うことができる機能である。内部でeBPFを用いている。USMを有効にするには、Datadog AgentとUnified Service Taggingを適切に設定する必要がある。USMによって得られたデータはService Catalogで閲覧可能である。
余談だが、Observabilityの手法は2つに大別できる。Push型とPull型である。DatadogはAgentをインストールするので、Push型である。Pull型の例としては、Prometheusがある。
Logs
Datadogでは、複数のLogsリソースから収集されたLogsを一元管理できる。
操作方法は以下の通り。
Time range
期間を指定できる
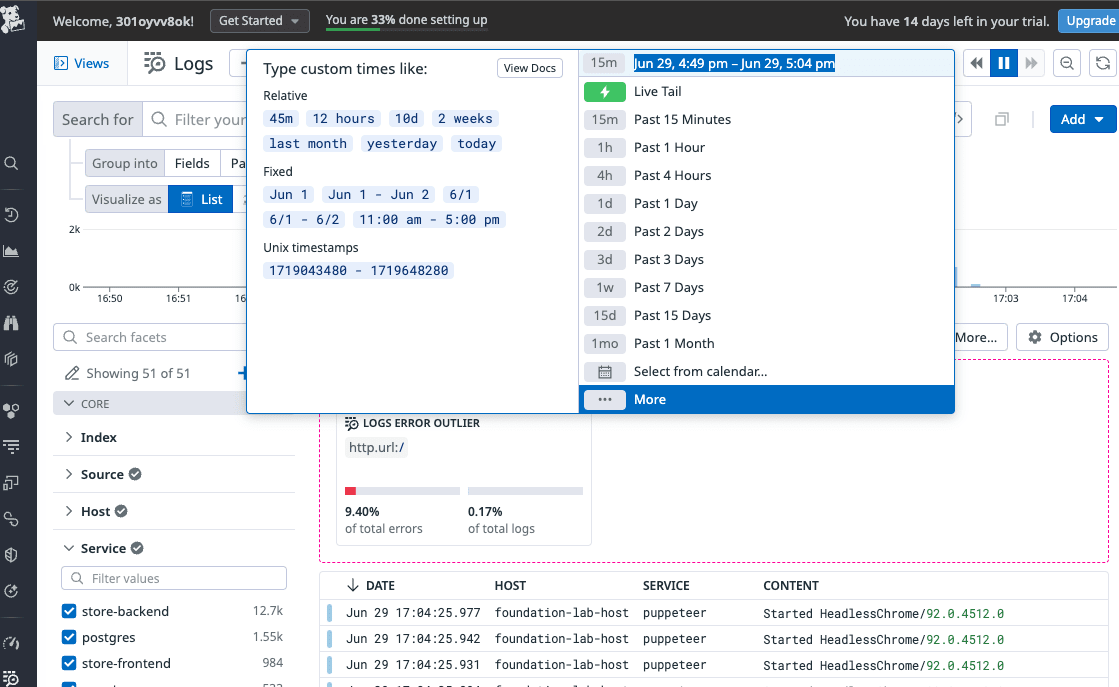
Fields
表示するLogsをフィルタリングできる

LogsのTag
各Logsにはタグがついており、これでフィルタリングできる

Event Attributes
LogsのアトリビュートをJSON形式で表示できる
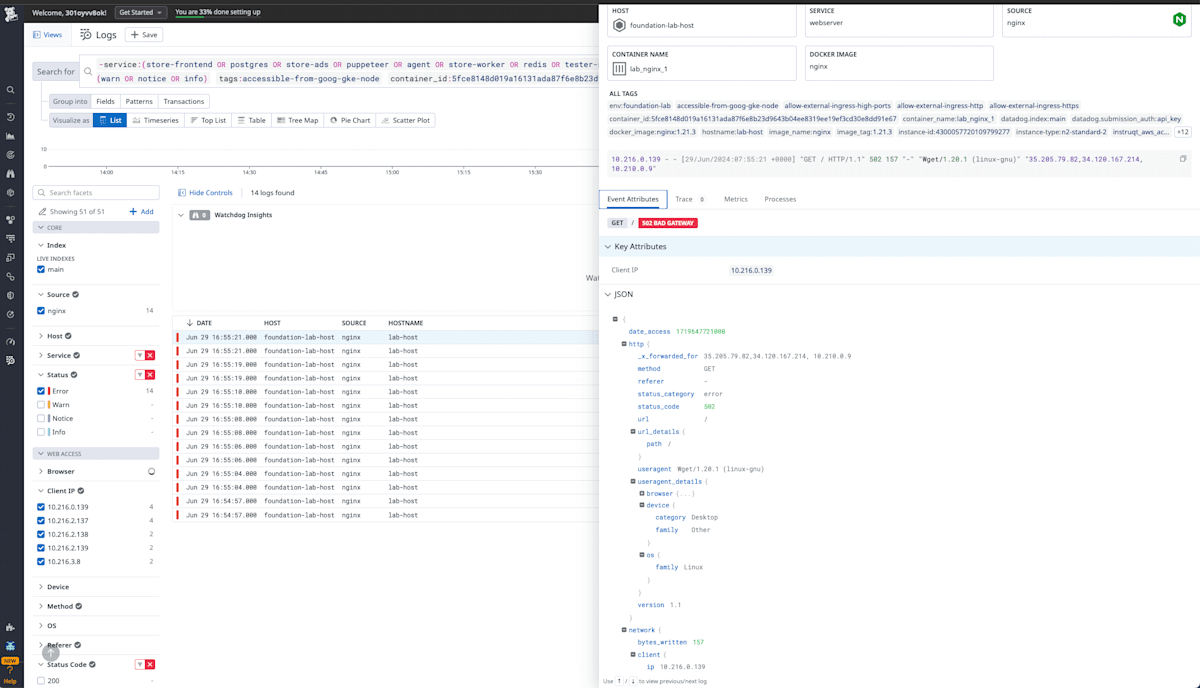
Metrics
Logs取得時のMetricsを表示できる

Custom facets
独自のフィルタリング項目を作成できる

Metrics
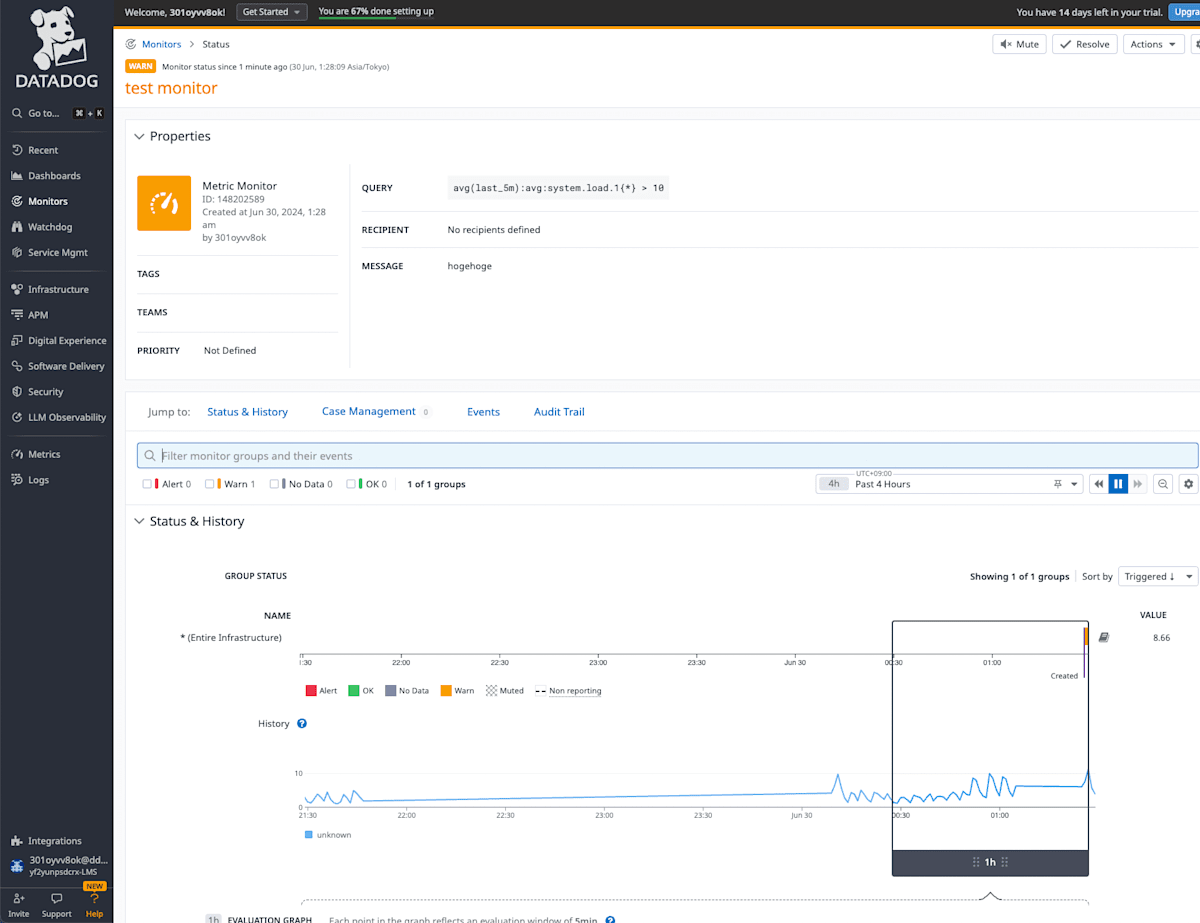
Datadogでは、Metricsはタイムスタンプと値のペアで表現される。Metricsと密接に関連する概念として、MonitorsとService Level Objective (SLO)がある。Monitorsは、Metricsが定義した許容範囲から外れた場合に通知を送信する。SLOは、サービスの品質を定量的に評価するための指標で、長期にわたって追跡される。
操作方法は以下の通り。
Facet panel and Metric details side panel
Metricsの詳細を確認できる

Metricsの可視化
Metricsをグラフで可視化できる


MetricsベースのMonitor作成
MetricsにもとづいてMonitorを作成できる
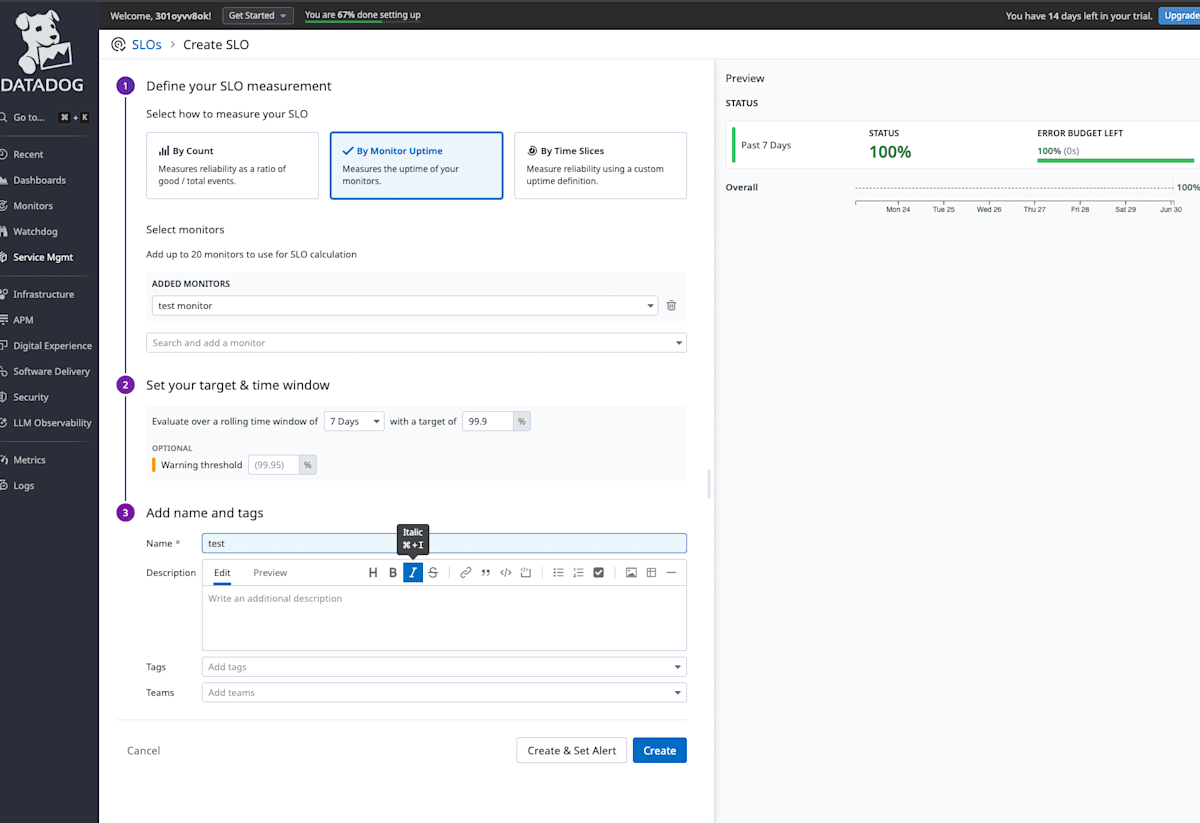
MonitorベースのSLO作成
MonitorにもとづいてSLOを作成できる
Integration
- Agent-based integrations are installed with the Datadog Agent and use a Python class method called
checkto define the metrics to collect.- Authentication (crawler) based integrations are set up in Datadog where you provide credentials for obtaining metrics with the API. These include popular integrations like Slack, AWS, Azure, and PagerDuty.
- Library integrations use the Datadog API to allow you to monitor applications based on the language they are written in, like Node.js or Python.
Datadogには3つのIntegrationタイプがある。各Integrationの詳細はこちらから確認できる。
Integration一覧と設定

Dashboards
Dashboardsは、Datadogに送信したデータをチャート、表、メモなど様々な形式で表示するための目玉機能。
操作方法は以下の通り。
Dashboardのクローン
既存のDashboardをコピーし、新しいDashboardを作成できる
コピー元

コピー先

新しいDashboardの作成
新しいDashboardを作成できる

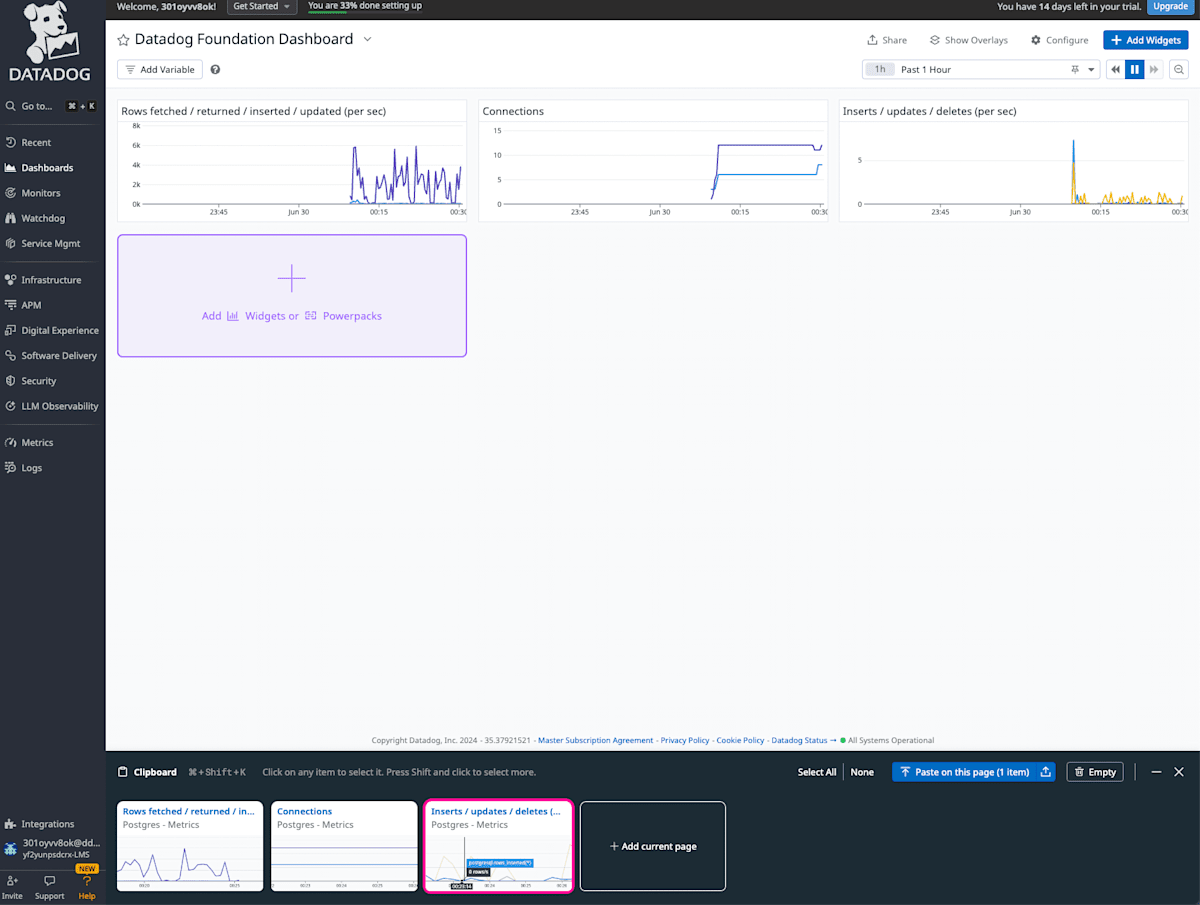
Widgetsのコピー
⌘+C/Vでwidgetsをコピぺ、⌘+Shift+Kでクリップボードの確認ができる
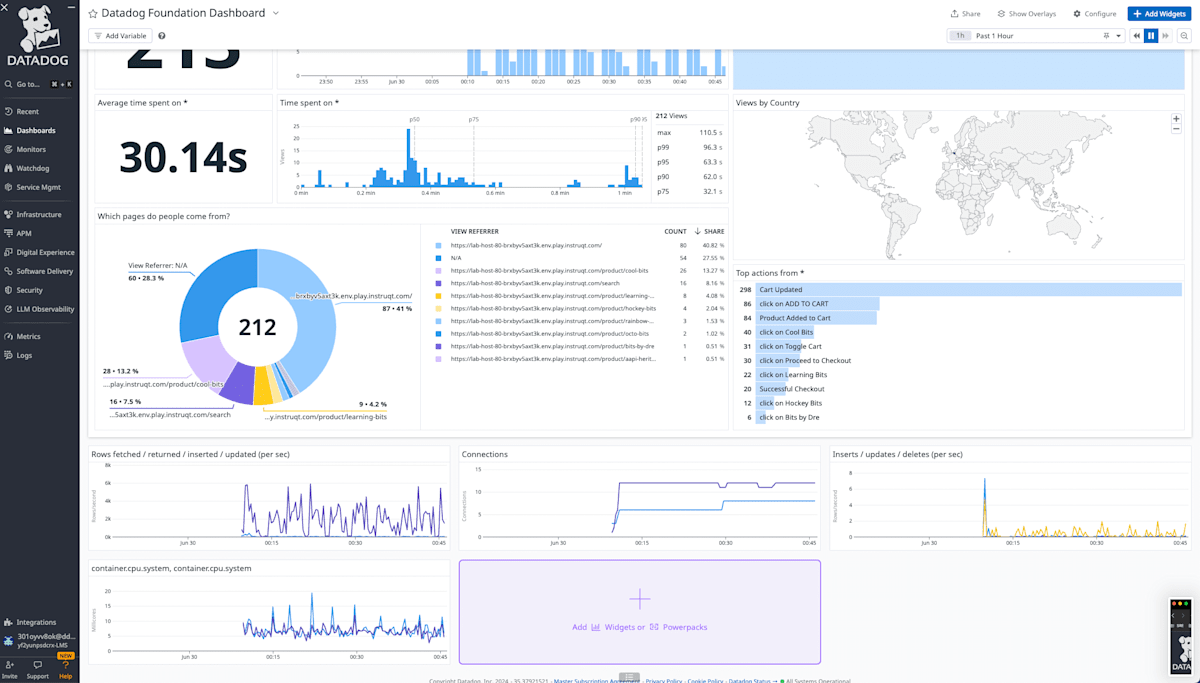
Widgetsの追加
新しいwidgetsを追加できる

また、Powerpack Widgetを利用することで、より高度なウィジェットを簡単に追加できる

グループ化
⌘Gでwidgetsのグループ化、解除するにはドラッグ&ドロップで行うことができる

Metrics ExplorerでMetrics作成→Dashboardにエクスポート
Metrics ExplorerでMetricsを作成し、そのMetricsをDashboardにエクスポートできる

まとめ
今回は、Datadog Learning Centerを利用することで、Datadogの基本操作を学ぶことができた。
1日あれば十分に学べる内容であるため、興味がある方はぜひ試してみてほしい。

Discussion