ハドレーのいうことをしんじるな: ggplot2の書き出しを制御する
線の太さをしんじるな
tl;dr
mmにしたければgeom_line()やelement_line()のsizeを0.75でわろう!
説明
困っているのはこれ:
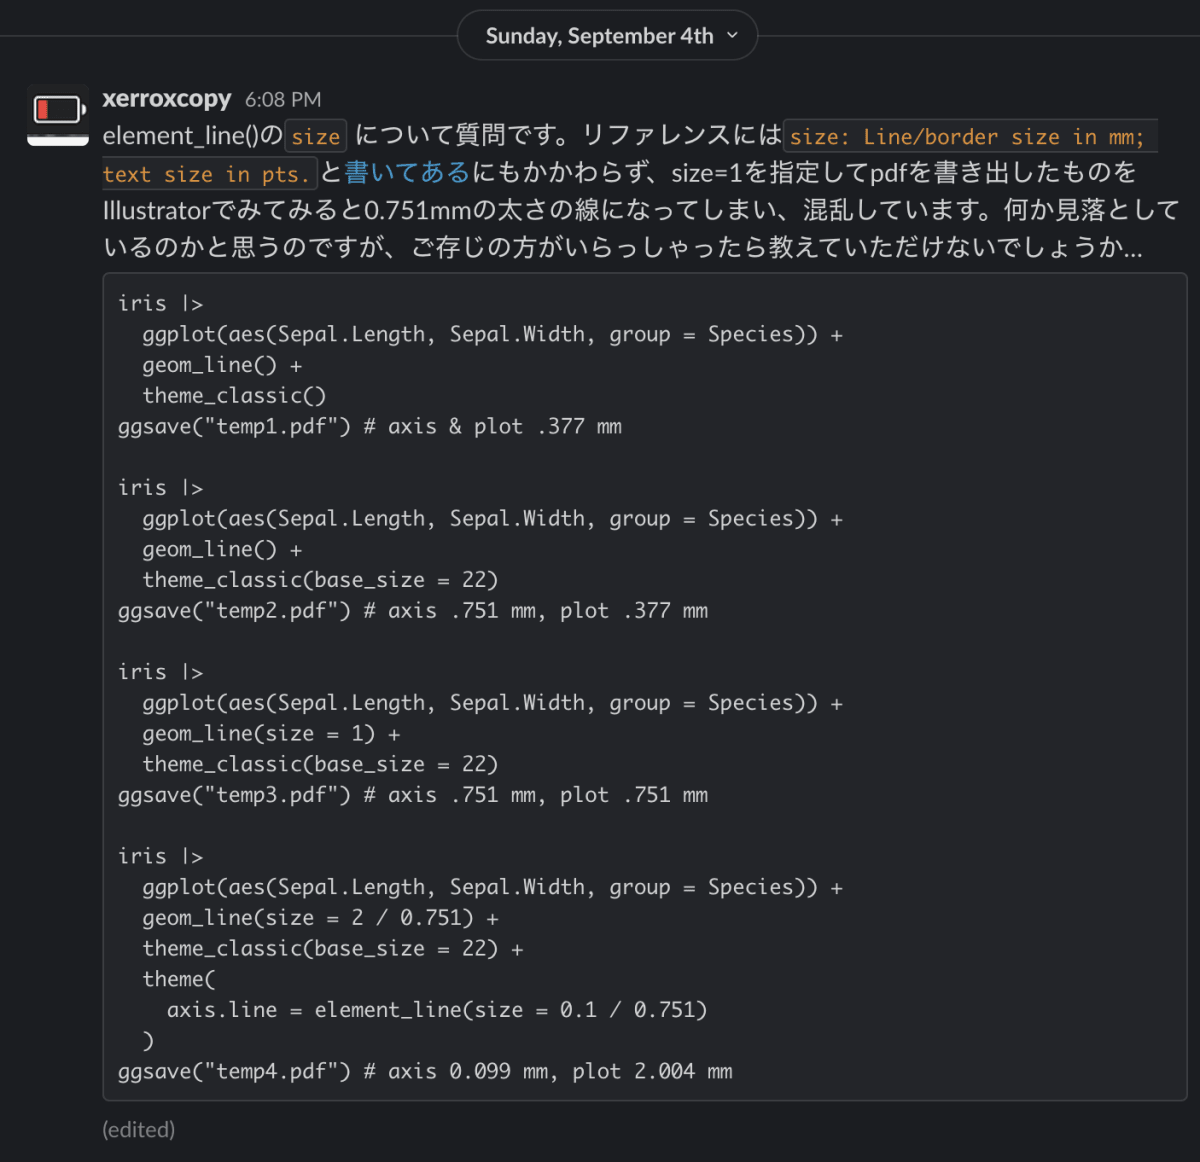
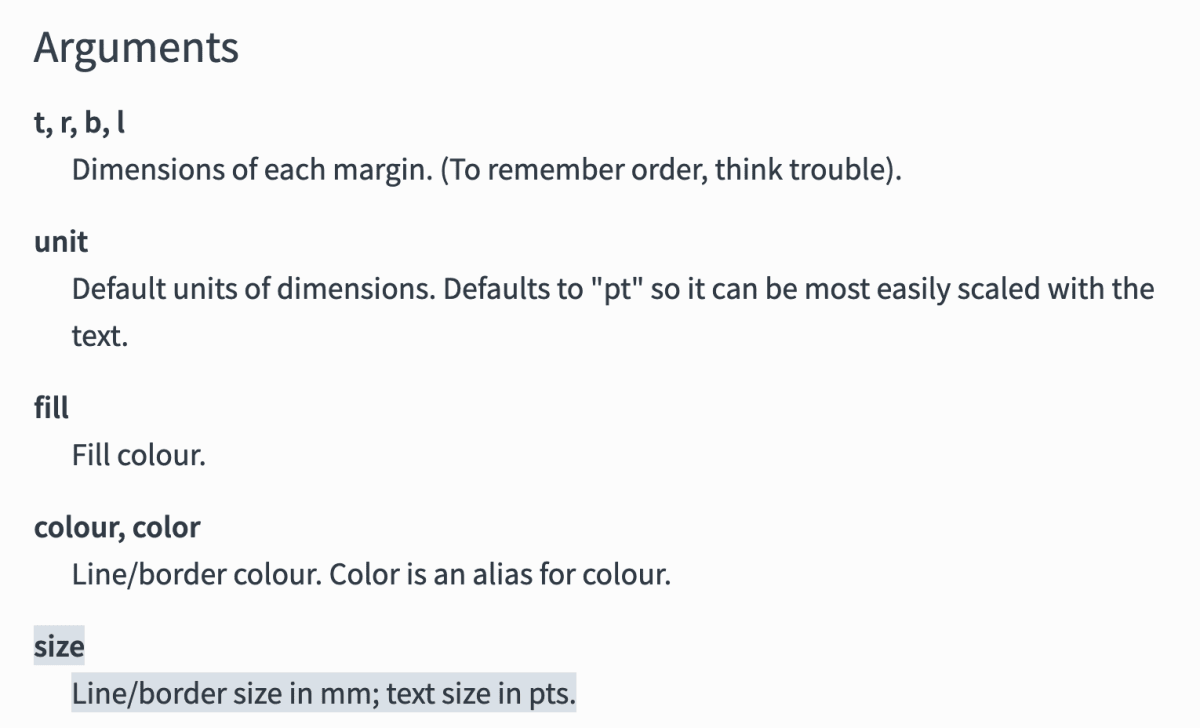
マニュアルにおいて、element_line()などで使われるサイズはmm単位であると、size: Line/border size in mm; text size in pts.と書いてある:
にもかかわらず、実際には数値を/ 0.751しないとmmには変換されない。もしかすると/ .75でいいのかもしれないが…。実際にやってみるとこうなる:
iris |>
  ggplot(aes(Sepal.Length, Sepal.Width, group = Species)) +
  geom_line() +
  theme_classic()
ggsave("temp1.pdf") # axis & plot .377 mm

iris |>
  ggplot(aes(Sepal.Length, Sepal.Width, group = Species)) +
  geom_line() +
  theme_classic(base_size = 22)
ggsave("temp2.pdf") # axis .751 mm, plot .377 mm

iris |>
  ggplot(aes(Sepal.Length, Sepal.Width, group = Species)) +
  geom_line(size = 1) +
  theme_classic(base_size = 22)
ggsave("temp3.pdf") # axis .751 mm, plot .751 mm

iris |>
  ggplot(aes(Sepal.Length, Sepal.Width, group = Species)) +
  geom_line(size = 2 / 0.751) +
  theme_classic(base_size = 22) +
  theme(
    axis.line = element_line(size = 0.1 / 0.751)
  )
ggsave("temp4.pdf") # axis 0.099 mm, plot 2.004 mm

iris |>
  ggplot(aes(Sepal.Length, Sepal.Width, group = Species)) +
  geom_line(size = 2 / 0.751) +
  theme_classic(base_size = 6) +
  theme(
    axis.line = element_line(size = 0.1 / 0.751)
  )
ggsave("temp5.pdf") # axis 0.098 mm, plot = 2.003 mm
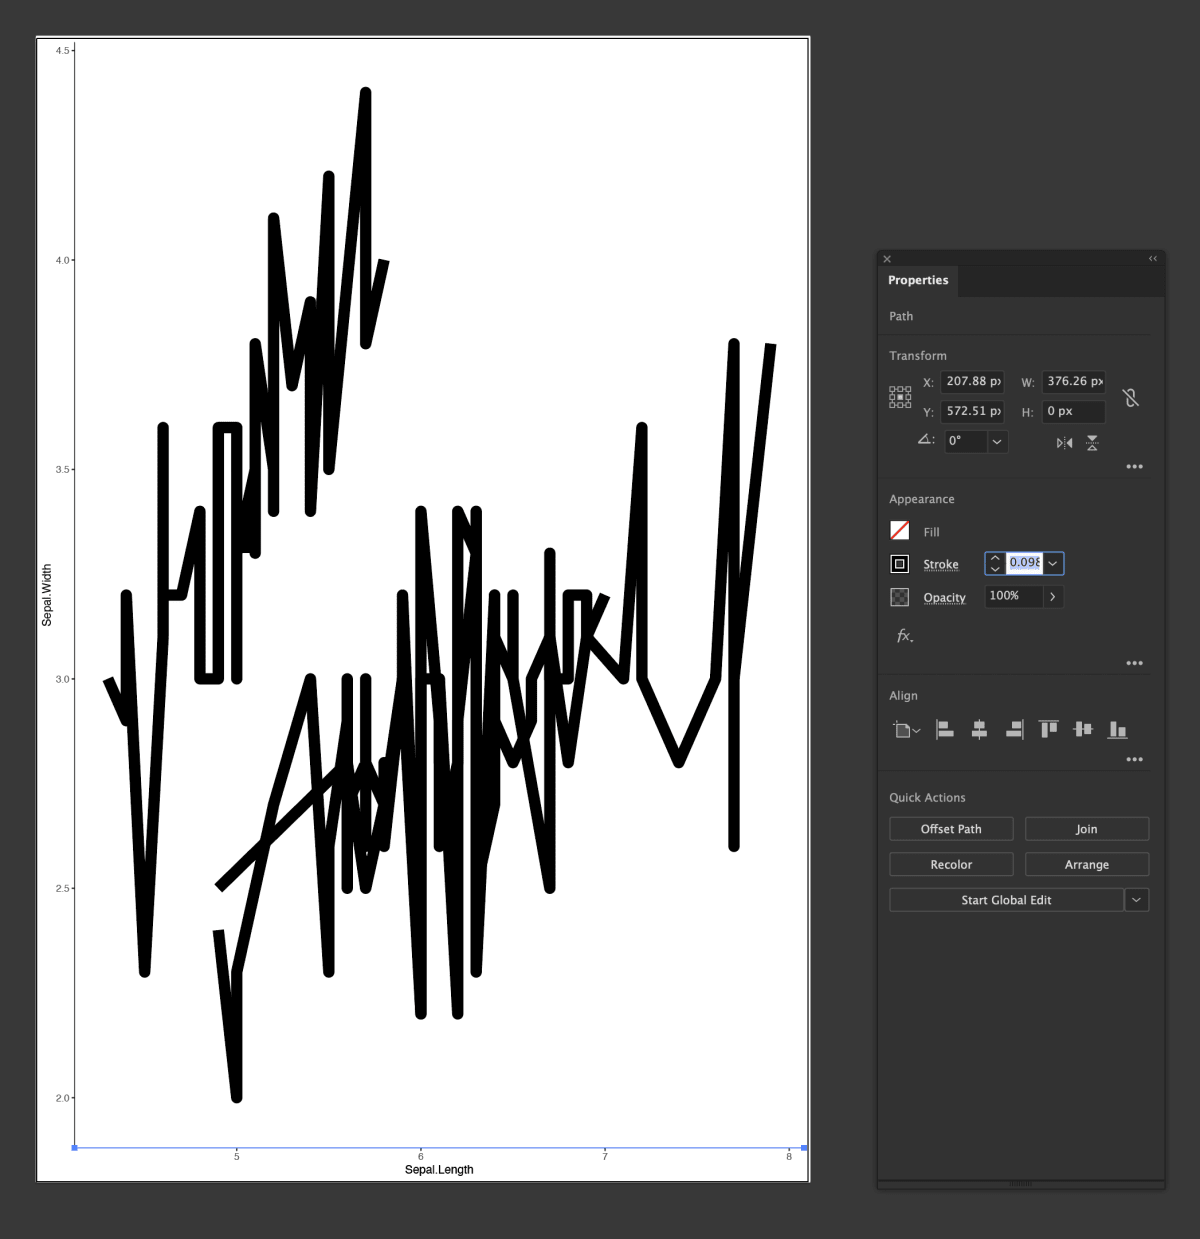
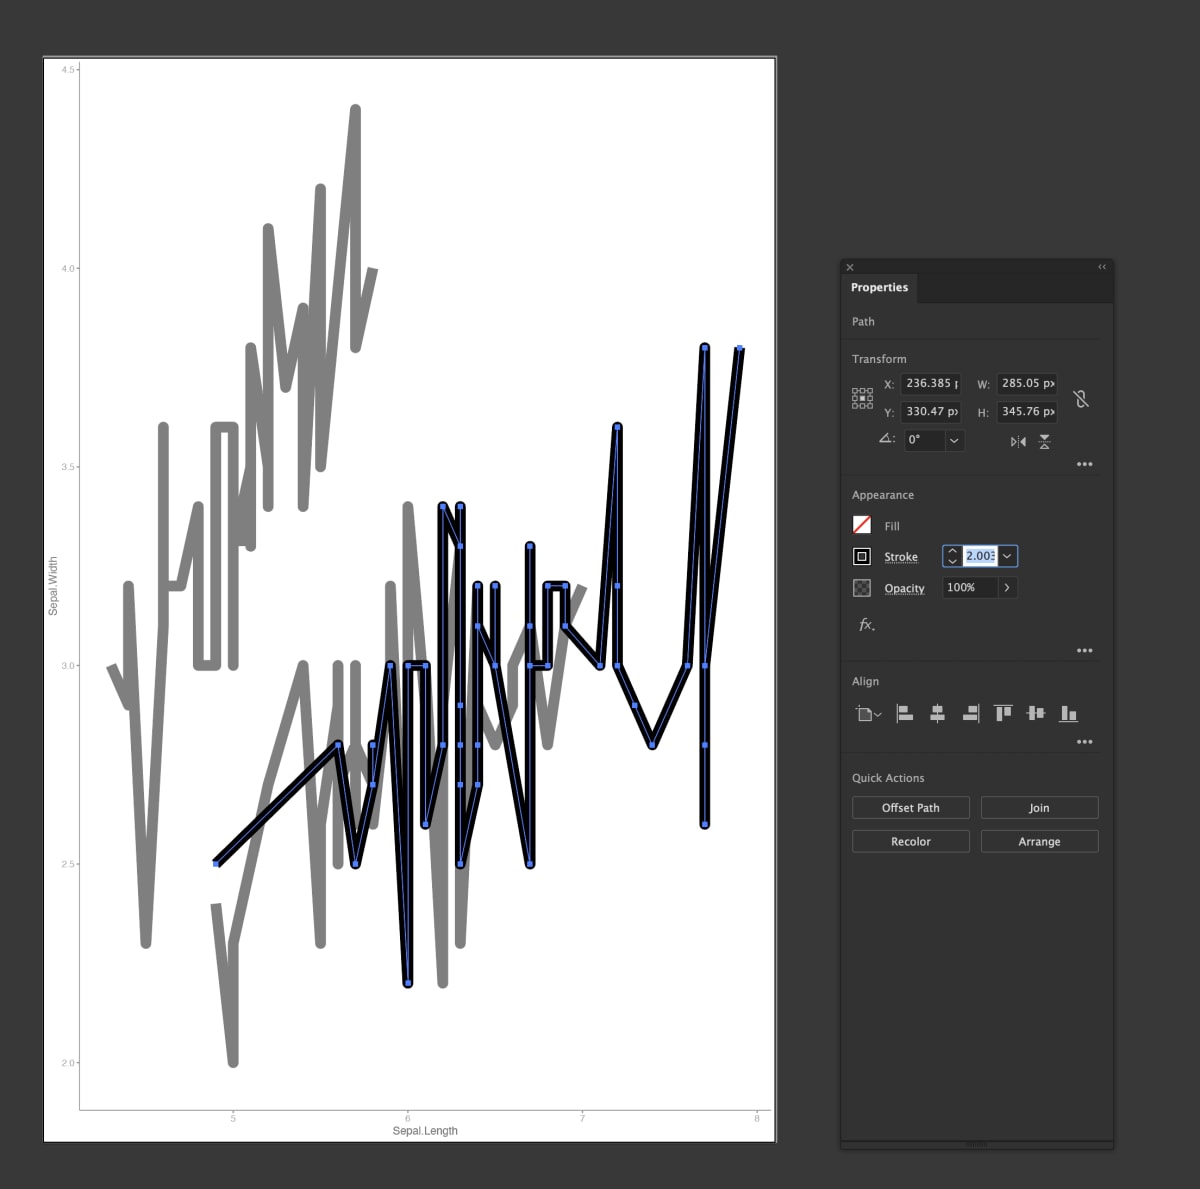
たとえばtemp5.pdfをみてみよう:
ぴったりの値にならないことはggplot2の宿痾(なぜだかは忘れたが…)なのでいいのだが、マニュアルはやはりかなり間違っている。
フォントサイズをしんじるな
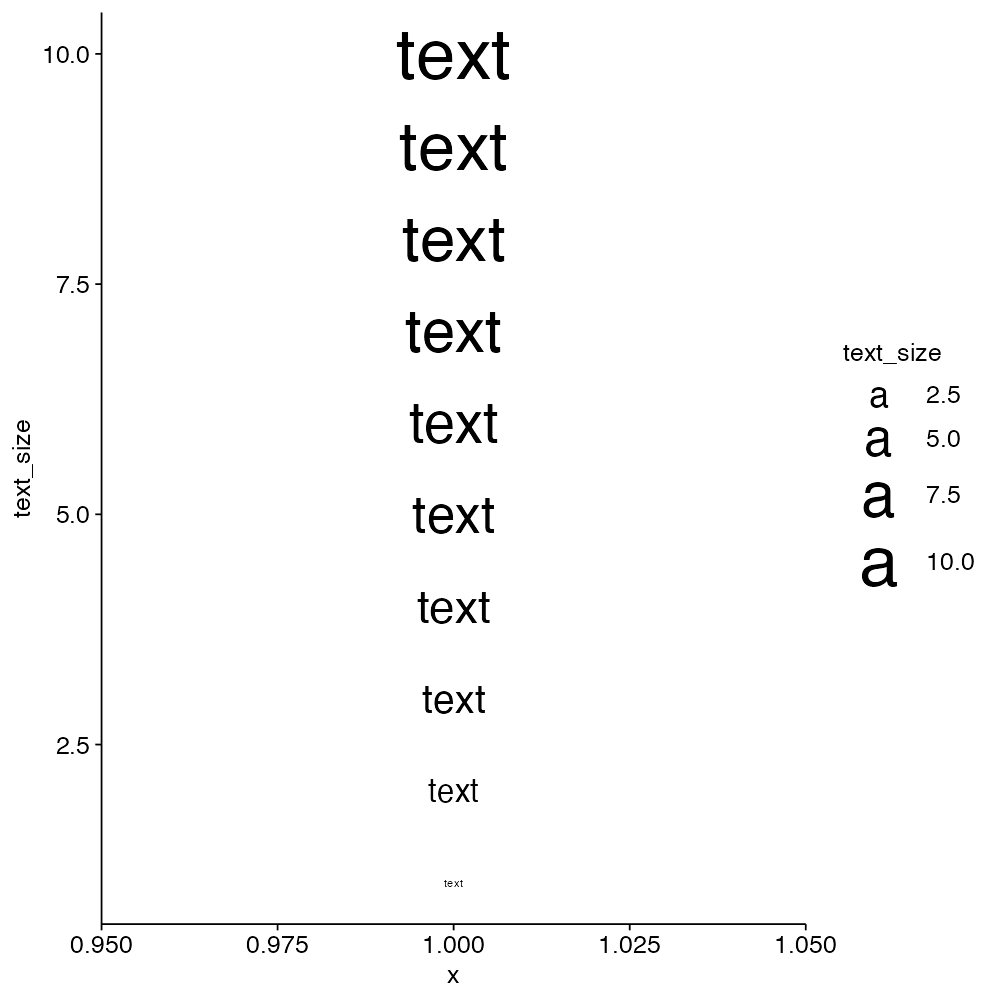
geom_text()をaesでコントロールすると、sizeを2から3にするとものすごく大きくなるのに、10から11にしてもほとんど大きくならない。下から順にsize = 1、size = 2と10までプロットしたもの。
  tibble(text_size = 1:10) |>
  ggplot(aes(x = 1, y = text_size, label = "text", size = text_size)) +
  geom_text(family = "Helvetica") +
  theme_cichlid
ggsave("./output/text_size_test_helvetica.png", width = 1000, height = 1000, units = "px")
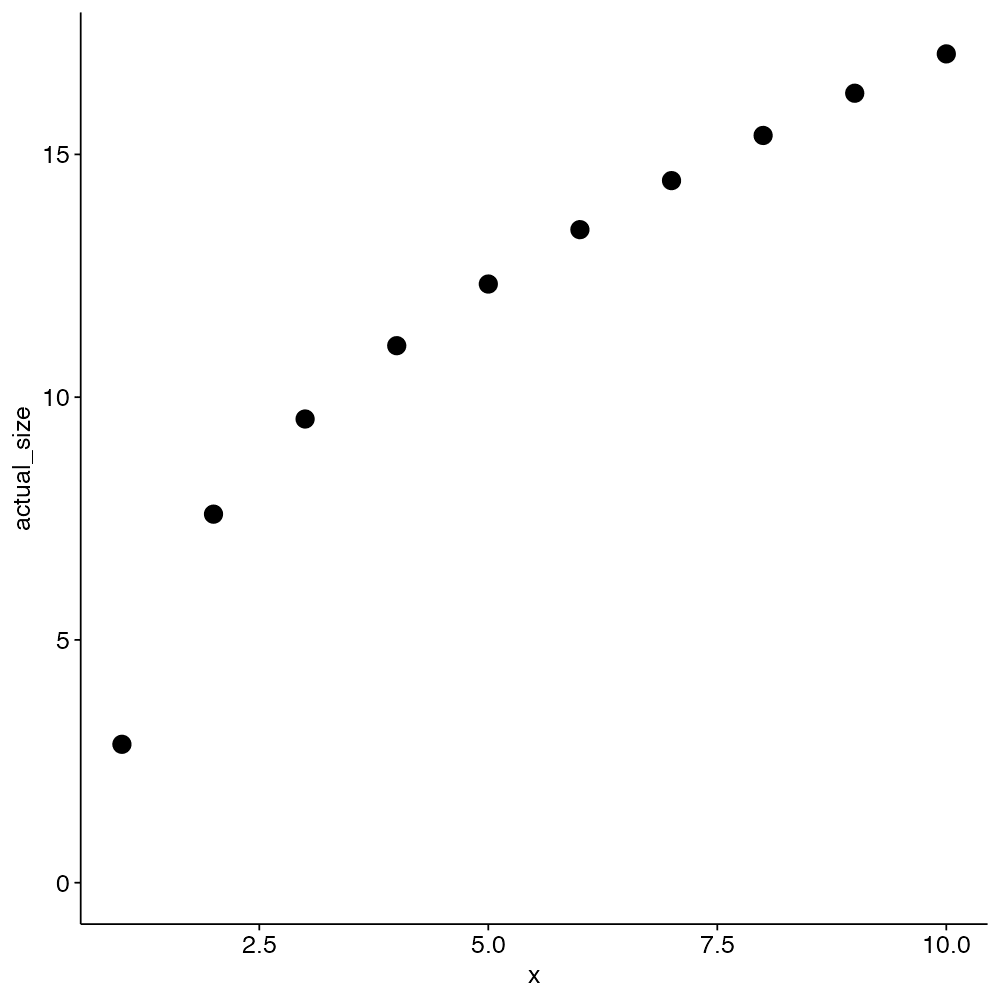
これのフォントサイズをIllustratorで地道に測るとこうなる:
tibble(
  actual_size = c(2.85, 7.59, 9.55, 11.06, 12.33, 13.45, 14.46, 15.39, 16.26, 17.07),
  x = 1:10
) |>
  ggplot(aes(x, actual_size)) +
  geom_point() +
  scale_y_continuous(limits = c(0, NA)) +
  theme_cichlid
ggsave("./output/text_size_relationship.png", width = 1000, height = 1000, units = "px")
これを理解するのにだいぶ手間取ったが、以下のような性質があるようだ:
pt_convert <- .352777778
GeomLabel$default_aes$size / pt_convert  # 10.99843

expand_grid(text_size = c(1:10), condition = 0:7) |>
  ggplot(aes(y = text_size, x = condition,  label = "manual")) +
  geom_point(colour = "transparent") +
  geom_text(x = 0, y = .5, size = .5) + # 1.42pt
  geom_text(x = 0, y = 1, size = 1) + # 2.85pt
  geom_text(x = 0, y = 2, size = 2) + # 5.69
  geom_text(x = 0, y = 3, size = 3) + # 8.54
  geom_text(x = 0, y = 3.5, size = 3.88) + # 11.04pt
  geom_text(x = 0, y = 4, size = 4) + # 11.38
  geom_text(x = 0, y = 5, size = 5) + # 14.23
  geom_text(x = 0, y = 6, size = 6) + # 17.07
  geom_text(x = 0, y = 7, size = 7) + # 19.92
  geom_text(x = 0, y = 8, size = 8) + # 22.76
  geom_text(x = 0, y = 9, size = 9) + # 25.61
  geom_text(x = 0, y = 10, size = 10) + # 28.45
  geom_text(x = 1, y = .5, size = .5 * pt_convert, colour = "red") + # .5pt
  geom_text(x = 1, y = 1, size = 1 * pt_convert, colour = "red") + # 1pt
  geom_text(x = 1, y = 2, size = 2 * pt_convert, colour = "red") + #
  geom_text(x = 1, y = 3, size = 3 * pt_convert, colour = "red") + #
  geom_text(x = 1, y = 4, size = 4 * pt_convert, colour = "red") + #
  geom_text(x = 1, y = 5, size = 5 * pt_convert, colour = "red") + #
  geom_text(x = 1, y = 6, size = 6 * pt_convert, colour = "red") + # 6.02pt
  geom_text(x = 1, y = 7, size = 7 * pt_convert, colour = "red") + #
  geom_text(x = 1, y = 8, size = 8 * pt_convert, colour = "red") + #
  geom_text(x = 1, y = 9, size = 9 * pt_convert, colour = "red") + #
  geom_text(x = 1, y = 10, size = 10 * pt_convert, colour = "red") + # 10.04
  geom_text(x = 2, family = "Helvetica", aes(size = text_size, label = text_size)) +
  geom_text(x = 3, family = "Swift", label = "123Swift", aes(size = text_size, )) +
  geom_text(x = 4, label = "NA", size = NA) + # 12pt
  geom_text(x = 5, label = "default_aes", size = GeomLabel$default_aes$size) + # 11.04pt
  geom_text(x = 6, label = "3.88", size = 3.88) + # # 11.04pt
  geom_text(x = 7, label = "default", size = 4) + # # 11.38pt
  scale_y_continuous(limits = c(0, NA)) +
  theme_cichlid +
  theme(legend.position = "none", aspect.ratio = .5)
ggsave("./output/text_size_test.svg")
ggsave("./output/text_size_test.png", width = 2000, height = 1000, units = "px")
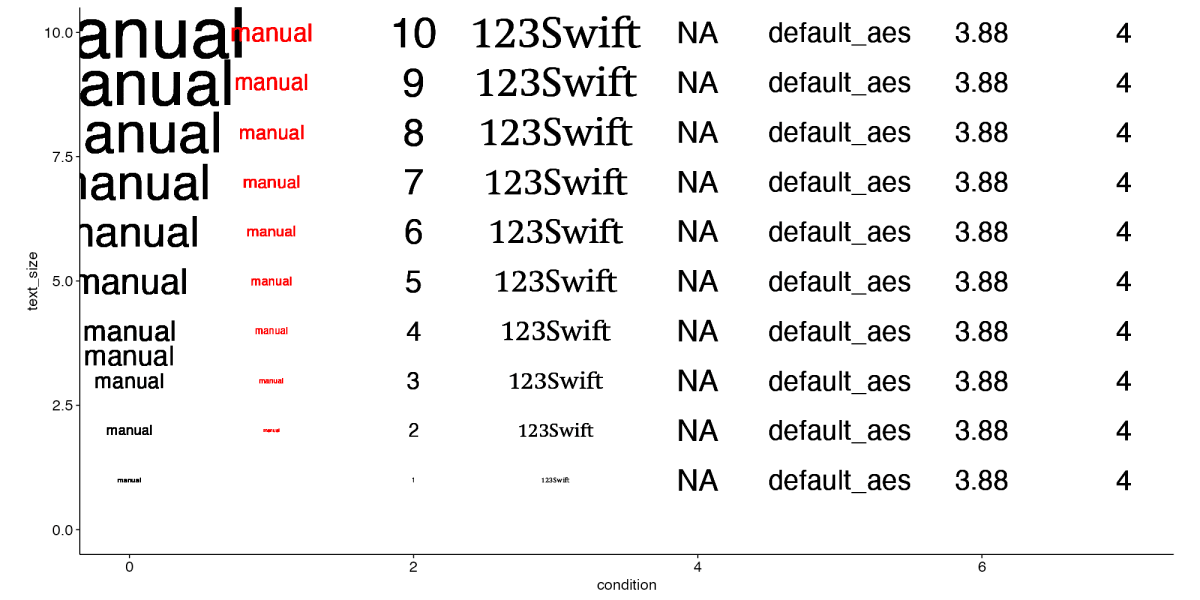
これによって次のようなことがわかった:
-
geom_text()内やaes()でコントロールしなければ、geom_text()のsizeはデフォルトのGeomLabel$default_aes$size、つまり3.88になる[1] -
sizeを直接指定した場合、フォントサイズは線形に大きくなる。size = 1で2.85ptになり、size = 10で28.45ptになる。 - フォントサイズで指定したい場合、
.352777778をかければよい。たとえば最終的なPDFで6ptにしたければsize = 6 * .352777778と指定する。微妙にずれるが許容範囲だろう。 -
aes()内でフォントサイズを指定し、パラメトリックに変化させようとするとだいぶ様相がかわる。- まず、線形で増えずにルートっぽく増える。これは
scale_size()のマニュアルに書いてあるとおり("The size aesthetic is most commonly used for points and text, and humans perceive the area of points (not their radius), so this provides for optimal perception")、文字の大きさを面積に比例して大きく感じるためのようだ。そして、 -
aes()でコントロールする場合、そのパラメータの上限と下限によってサイズが異なる。最小の値に対応するテキストが2.85pt, 最大の値に対応するテキストが17.07ptとなる。上記の例ではtext_size = c(1:10)で指定しているので、1が2.85pt, 10が17.07ptに対応するようになっているが、これがたとえば0.5から始まるようにすれば0.5が2.85pt, 10が17.07ptにリマップされる。ややこしい…。マップする範囲はscale_size(limits = c(3, 6))などとすれば指定できる。3pt~6ptの範囲のフォントサイズに対応させたければ、scale_size(limits = c(3, 6) * .352777778)とすればいける…はず。やってない。
- まず、線形で増えずにルートっぽく増える。これは
- フォントサイズを
NAに指定するとなぜか12ptになる。 - フォントファミリーは
aesでサイズを指定していても関係ない(よかった…)。 -
geom_text()内のフォントサイズはtheme_grey(base_size = xxx)に依存しない。
aes()内で指定した場合と、geom_text()内で指定した場合の実際のフォントサイズの差はこうなる:
tibble(
  aes_pt = c(2.85, 7.59, 9.55, 11.06, 12.33, 13.45, 14.46, 15.39, 16.26, 17.07),
  manual_pt = c(2.85, 5.69, 8.54, 11.38, 14.23, 17.07, 19.92, 22.76, 25.61, 28.45),
  x = 1:10
) |>
  pivot_longer(cols = ends_with("pt"), names_to = "settings", values_to = "pt") |>
  ggplot(aes(x, pt, colour = settings)) +
  geom_line() +
  geom_point() +
  geom_point(x = 3.88, y = 11.04, colour = "red") +
  geom_point(x = 4, y = 11.38, colour = "blue") +
  scale_y_continuous(limits = c(0, NA)) +
  theme_cichlid
ggsave("./output/text_size_relationship2.png", width = 2000, height = 1000, units = "px")
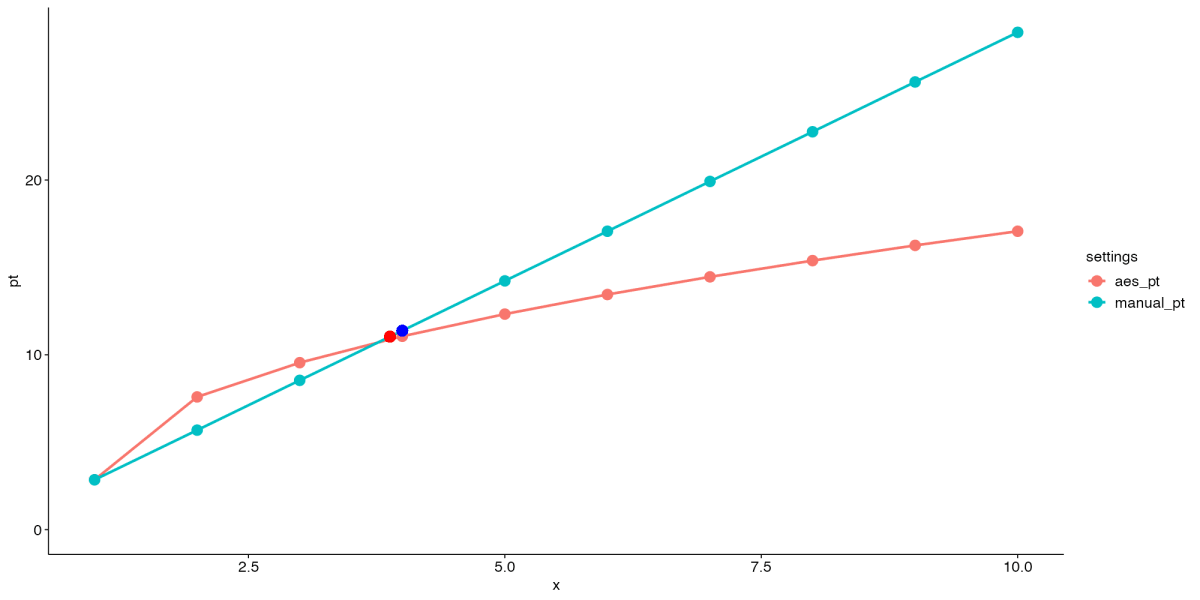
3.88付近の値がぐちゃぐちゃになってしまっているが…。ややこしい。
Natureの論文のプロットを参考に汎用のテーマを作った
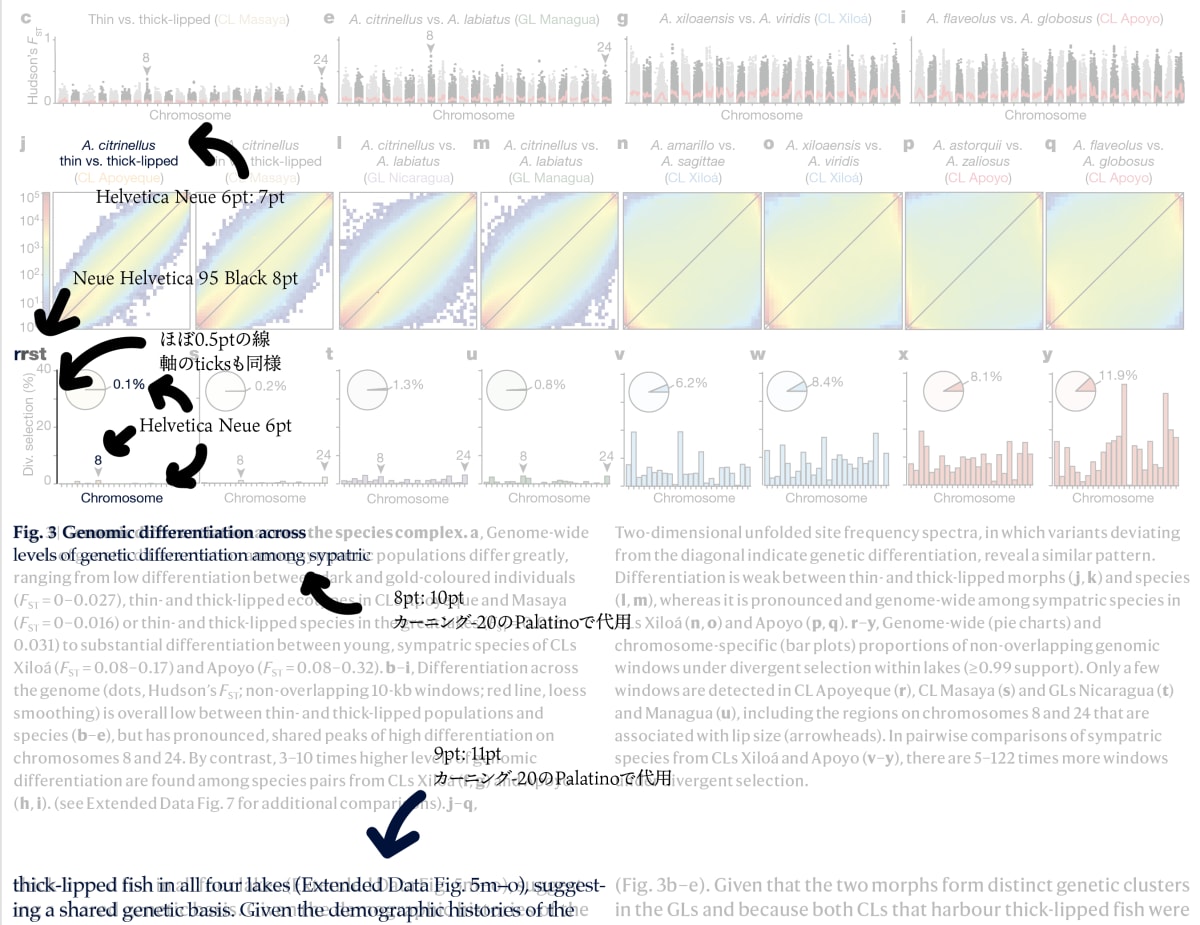
Kautt et al. (2020)[2]の図表はこのようになっていた:
これをなるべく再現するためのtheme()
theme_cichlid <-
  theme_minimal(base_size = 6, base_family = "Helvetica") +
  theme(
    line = element_line(size = .15/.751, colour = "black"),
    text = element_text(size = 6, colour = "black"),
    title = element_text(size = 6, colour = "black"),
    panel.grid = element_blank(),
    axis.line = element_line(),
    axis.text = element_text(size = 6, colour = "black"),
    axis.ticks = element_line(),
    plot.background = element_rect(fill = "white", colour = NA),
    strip.text = element_text(size = 6),
    legend.text = element_text(size = 6),
    legend.key.size = unit(3, units = "mm")
  )
geom_text()の場合は
geom_text(family = "Helvetica", size = 6 * .352777778)
とすればよいだろう[3]。
-
Kautt, A. F., et al. (2020) Contrasting signatures of genomic divergence during sympatric speciation. Nature. 588, 106-111 ↩︎
-
extrafontsなどで他のフォントを追加すると、Macでの
geom_text()のデフォルトフォントであったはずのHelveticaがArialに闇落ちする。そのためいちいち指定する必要がでてくる。 ↩︎
Discussion