ごきげんよう!mihohoi です。
AKS で Windows コンテナーを動かすことができるのはご存知でしょうか。
ほとんどの場合は Linux ノードの上にコンテナーを作成していきますが、どうしても Windows コンテナーで稼働させたいアプリケーションも中にはあります。
そういった場合に、AKS では Windows ノードを追加し、その上で Windows コンテナーを稼働させることができます。
Linux と同じように運用しても問題ないのか?それは少し違うと個人的には思います。ということで、今回は「ログ」についてまとめます。
Windows コンテナーのベースイメージとして複数用意されています。servercore もそのうちの一つです。Windows Server の運用をしていた方は分かるかと思いますが、EventLog など Windows では Linux と異なるログの出力方法があります。
そのようなログを取得したい場合、コンテナーとして標準出力に出せるのかというと少し工夫が必要です。今回は実際に Windows コンテナーを作成して確認していきます。
AKS を作成して、Windows ノードプールを追加する
それではまず AKS クラスターを作成し、Windows ノードを追加します。基本的にはドキュメントに記載の通りですが、若干変えています。
まずは、変数を設定しておきます
myResourceGroup=<リソースグループ名>
myAKSCluster=<クラスター名>
location=eastus

# クラスターの Windows Server ノードの管理者資格情報として使用するユーザー名を作成します。
WINDOWS_USERNAME=azureadmin
# Windows 管理者ユーザー名のパスワードを作成します。
WINDOWS_PASSWORD=<password>
Windows パスワード要件は、こちらを参照してください。毎回何にしようか悩んでます。
はじめにリソースグループを作成します。
az group create \
  --name $myResourceGroup \
  --location $location
AKS を作成します。今回は、--windows-admin-username パラメーターと --windows-admin-password パラメーターを指定し、Windows Server ノードの管理者資格情報を設定します。
az aks create \
  --name $myAKSCluster \
  --resource-group $myResourceGroup \
  --location $location \
  --enable-addons monitoring \
  --node-count 2 \
  --generate-ssh-keys \
  --windows-admin-username $WINDOWS_USERNAME \
  --windows-admin-password $WINDOWS_PASSWORD \
  --vm-set-type VirtualMachineScaleSets \
  --network-plugin azure
作成したクラスターに Windows ノードプールを追加します。VM サイズを指定しているのは、少し大きめのリソースを使いたいからです。
az aks nodepool add --resource-group $myResourceGroup --cluster-name $myAKSCluster --os-type Windows --name win01 --node-vm-size Standard_D8s_v3 --node-count 1
しばらくすると、ノードが追加されます。クラスターに接続します。
az aks get-credentials --resource-group $myResourceGroup --name $myAKSCluster
ノードプールが Linux および Windows と 2 種類作成されていることを確認します。以下は表示例です。Windows Server 2022 がノードとして追加されていることがわかります。
% kubectl get node -o wide
NAME                                STATUS   ROLES   AGE   VERSION   INTERNAL-IP   EXTERNAL-IP   OS-IMAGE                         KERNEL-VERSION      CONTAINER-RUNTIME
aks-nodepool1-19368188-vmss000000   Ready    agent   33m   v1.27.7   10.224.0.33   <none>        Ubuntu 22.04.3 LTS               5.15.0-1052-azure   containerd://1.7.5-1
aks-nodepool1-19368188-vmss000001   Ready    agent   33m   v1.27.7   10.224.0.4    <none>        Ubuntu 22.04.3 LTS               5.15.0-1052-azure   containerd://1.7.5-1
akswin01000000                      Ready    agent   12m   v1.27.7   10.224.0.62   <none>        Windows Server 2022 Datacenter   10.0.20348.2113     containerd://1.6.21+azure
準備はこれで完了です。次はようやく Windows コンテナーを作成していきます。
Windows コンテナーデプロイ
テスト用に servercore を作成し、デプロイします。すでに存在している Azure Container Registry に対してイメージを保存します。もし作成されていない場合は、こちらを参照して作成してください。
既存の Azure Container Registry と作成した AKS を統合させます。
myACR=<Azure Container Registry 名>
az aks update -n $myAKSCluster -g $myResourceGroup --attach-acr $myACR
ローカルで Dockerfile を作成します。まずは、何もない状態のコンテナーを作成します。
FROM mcr.microsoft.com/windows/servercore:ltsc2022

# IISをインストール
RUN powershell -Command Add-WindowsFeature Web-Server

# IISを実行
CMD ["powershell", "-Command", "Start-Service W3SVC; while ($true) { Start-Sleep -Seconds 30 }"]
この Dockerfile をビルドし、ACR に格納します。
% az acr login --name $myACR
% docker build -t $myACR.azurecr.io/servercore:v2 .
% docker push $myACR.azurecr.io/servercore:v2
格納できたら、AKS にデプロイするためにファイルを作成します。yaml ファイルは以下の通りです。名前などは適宜変更してください。
apiVersion: apps/v1
kind: Deployment
metadata:
  name: win01
spec:
  selector:
    matchLabels:
      app: win01
  template:
    metadata:
      labels:
        app: win01
    spec:
      nodeSelector:
        "kubernetes.io/os": windows
      containers:
      - name: win01
        image: $myACR.azurecr.io/servercore:v2
        resources:
          limits:
            memory: 800M
            cpu: 1
実行し、ログを確認します。
%  kubectl apply -f sample-win2.yaml
deployment.apps/win01 created
%  kubectl get po
NAME                          READY   STATUS    RESTARTS   AGE
win01-7489f89d4d-l4px2        1/1     Running   0          7s
% kubectl logs win01-7489f89d4d-l4px2
"コンテナは実行中です... && timeout /t -1"
ログが表示されていることがわかりました。
Windows コンテナーのログを確認したい
Linux の場合は、stdout/err が特に何も設定せずに Log Analytics から閲覧することができます。
Windows コンテナーの場合も ContainerLogv2 で、stdout/err が Log Analytics に出力されます。ただ、それ以外にも出力したいものはあります。例えば、EventLog などです。そのため、Linux とはログの出力方法が異なります。
Windows コンテナーでも stdout/err は kubectl からおなじみのコマンドで閲覧できます。例えばこんな感じです。
% kubectl logs win-sample-7b4b4b6c9f-74pqd
2023-12-27 04:50 hello, log
2023-12-27 04:55 hello, log
ただし、イベントログなどは stdout/err に表示されません。
試しに先ほど作成したコンテナーに入り、EventLog を作成してみます。
% kubectl exec -it win01-8c546d895-rxtm5 -- powershell
Windows PowerShell
Copyright (C) Microsoft Corporation. All rights reserved.

Install the latest PowerShell for new features and improvements! https://aka.ms/PSWindows

PS C:\> Get-EventLog -LogName Application

   Index Time          EntryType   Source                 InstanceID Message
   ----- ----          ---------   ------                 ---------- -------
      57 Dec 27 09:37  Error       Software Protecti...   3221233670 License Activation (slui.exe) failed with the following error code:...
      56 Dec 27 09:37  Information Software Protecti...   1073742827 The Software Protection service has completed licensing status check....
      55 Dec 27 09:37  0           Software Protecti...   1073742726 The Software Protection service has started....
      54 Dec 27 09:37  Error       Software Protecti...   3221226513 Failed to collect hardware data. Error code 0xD0000034.
(略)
kubectl los で出力されているかを確認します。(別のコンテナーを立ち上げたので名前が異なってます)
% kubectl logs win01-8c546d895-rxtm5
標準出力側には出てきません。そこで LogMonitor が登場します。
そこで LogMonitor
LogMonitor の詳しい仕組みなどは以下の方にも詳細に記載されています。
仕組み的には以下の図(ブログから抜粋)のとおり、LogMonitor を通して EventLog やカスタムのログファイルなどを stdout に出力しようということのようです。

では、実際に LogMonitor を導入してみましょう。
LogMonitor はこちらから入手できます。ダウンロードしたのち、コンテナー化するアプリケーションと同じフォルダに格納します。
LogMonitor の導入
先ほどの Dockerfile/yaml ファイルは一旦忘れて、あらたに Dockerfile を作成するところから進みます。
#LogMonitor directory contains LogMonitor.exe and LogMonitorConfig.json file
COPY ServiceMonitor.exe C:/
COPY LogMonitor/ C:/LogMonitor

WORKDIR /LogMonitor

# Application
RUN mkdir C:\inetpub\wwwroot\test
#IISアプリケーションプール作成
RUN ["powershell.exe" , "Install-WindowsFeature Web-Mgmt-Service"]
RUN ["powershell.exe", "New-WebAppPool -Name testPool"]

#IISアプリ作成
RUN ["powershell.exe", "New-WebApplication -Name 'testPool' -Site 'Default Web Site' -PhysicalPath 'C:\\inetpub\\wwwroot\\test' -ApplicationPool 'testPool'"]

EXPOSE 80

#LogMonitor起動
ENTRYPOINT C:\\LogMonitor\\LogMonitor.exe
ちなみに、Service Monitor はこちらからダウンロードしました。
LogMonitorConfig.json (LogMonitorでどのような内容を取得するかを記載する設定ファイル) はひとまず以下のようにしています。
EventLog の system と application を出力します。また、それぞれ異なった Level のログ (以上、だったかと) を取得するように設定しています。
{
  "LogConfig": {
    "sources": [
            {
        "type": "EventLog",
        "startAtOldestRecord": true,
        "eventFormatMultiLine": false,
        "channels": [
          {
            "name": "system",
            "level": "Error"
          },
          {
            "name": "application",
            "level": "Error"
          }
        ]
      },
            {
        "type": "File",
        "directory": "c:\\LogMonitor\\logs",
        "filter": "*.log",
        "includeSubdirectories": true
      }
    ]
  }
}
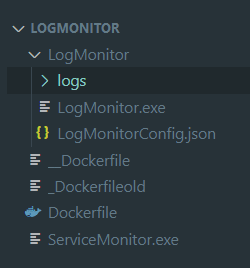
フォルダ構成は以下のようにしています。
作成した Dockerfile は、先ほどと同じようにコンテナー化して、Azure Container Registry に push します。コマンドは同じ内容なので省きます。
次に、AKS にデプロイするために yaml を作成します。
apiVersion: apps/v1
kind: Deployment
metadata:
  name: logmonitor
  labels:
    app: logmonitor
spec:
  replicas: 1
  template:
    metadata:
      name: logmonitor
      labels:
        app: logmonitor
    spec:
      nodeSelector:
        "kubernetes.io/os": windows
      containers:
      - name: logmonitor
        image: $myACR.azurecr.io/logmonitor:v1
        resources:
          limits:
            cpu: 1
            memory: 800M
  selector:
    matchLabels:
      app: logmonitor
これを AKS にデプロイします。そして、しばらく待ったのちに、kubectl コマンドを使ってログを見てみましょう。
% kubectl logs logmonitor-64fc45964d-lz4l6
<Source>EventLog</Source><Time>2022-08-06T10:00:12.000Z</Time><LogEntry><Channel>System</Channel><Level>Error</Level><EventId>7023</EventId><Message>The DiagHost service terminated with the following error:   The RPC server is unavailable.</Message></LogEntry>
<Source>EventLog</Source><Time>2022-08-06T10:00:12.000Z</Time><LogEntry><Channel>System</Channel><Level>Error</Level><EventId>7031</EventId><Message>The DiagHost service terminated unexpectedly.  It has done this 1 time(s).  The following corrective action will be taken in 60000 milliseconds: Restart the service.</Message></LogEntry>
<Source>EventLog</Source><Time>2022-08-06T10:00:53.000Z</Time><LogEntry><Channel>System</Channel><Level>Error</Level><EventId>7023</EventId><Message>The DiagHost service terminated with the following error:   The RPC server is unavailable.</Message></LogEntry>
<Source>EventLog</Source><Time>2022-08-06T10:00:53.000Z</Time><LogEntry><Channel>System</Channel><Level>Error</Level><EventId>7031</EventId><Message>The DiagHost service terminated unexpectedly.  It has done this 1 time(s).  The following corrective action will be taken in 60000 milliseconds: Restart the service.</Message></LogEntry>
<Source>EventLog</Source><Time>2022-08-06T03:01:54.000Z</Time><LogEntry><Channel>System</Channel><Level>Error</Level><EventId>7023</EventId><Message>The DiagHost service terminated with the following error:   The RPC server is unavailable.</Message></LogEntry>
<Source>EventLog</Source><Time>2022-08-06T03:01:54.000Z</Time><LogEntry><Channel>System</Channel><Level>Error</Level><EventId>7031</EventId><Message>The DiagHost service terminated unexpectedly.  It has done this 2 time(s).  The following corrective action will be taken in 120000 milliseconds: Restart the service.</Message></LogEntry>
<Source>EventLog</Source><Time>2022-08-06T03:03:54.000Z</Time><LogEntry><Channel>System</Channel><Level>Error</Level><EventId>7023</EventId><Message>The DiagHost service terminated with the following error:   The RPC server is unavailable.</Message></LogEntry>
<Source>EventLog</Source><Time>2022-08-06T03:03:54.000Z</Time><LogEntry><Channel>System</Channel><Level>Error</Level><EventId>7034</EventId><Message>The DiagHost service terminated unexpectedly.  It has done this 3 time(s).</Message></LogEntry>
stdout に出力されましたね。では、Log Analytics でも確認してみましょう。

LogMessage にログが出力されました。もう少し見やすくできないかなとも思いましたが、必要な内容については後で加工したり、アラートの場合は内容を grep できればいいので今回は特に何もしていません。
Log Analytics では必要以上な情報もテーブルで見れるので、見たいものだけ出力できるように KQL を書き換えてみましょう。
おわりに
なかなか奥が深いな、Windows コンテナー。ログの取得については、EventLog 以外にも取得できる項目があるので、使用する場合はぜひ GitHub のドキュメントを見てください。
参考

Discussion