【Chart.js + Next.js】Chart.jsのv3系でリアルタイムストリーミンググラフを作ってみた
はじめに
タイトルでは【Chart.js + Next.js】としてますが、やりたかったこととしてはNext.jsと限定せずReact.jsを用いてChart.js v3でリアルタイムストリーミンググラフを作成することです。Chart.jsのv2からv3のアップグレードで大きな変更もあったためなるべく最新のライブラリの状態で構築していきます!!
利用するライブラリについて
Chart.js
オープンソースで開発されているJavaScript でグラフを描画するためのライブラリであり一般的なグラフだけでなく様々な種類のグラフが描画できる(サンプルはこちら) 2021年8月にv3がリリースされセットアップ方法や依存パッケージ書き方までもが大幅にアップデートされている。
react-chart-js-2
Chart.jsをReact.js上で利用できるようにしたラッパーライブラリ
chartjs-plugin-streaming
リアルタイムストリーミングデータ向けのChart.jsの拡張プラグイン(サンプルはこちら) プル型(同期・非同期)とプッシュ型の両方のデータフィードに対応している
環境
- Next.js v12.2.5
- React.js v18.2.0
- Chart.js v3.9.1
- react-chart-js-2 v4.3.1
- chartjs-plugin-streaming v2.0.0
つくったもの
プル型(同期)でグラフを作成

導入からグラフ表示
プロジェクト作成
React.jsを動かせる環境であればNext.jsでもCreateReactAppでもOK。TypescriptやESLintやPrettierはお好みので。
npx create-next-app sample-nextjs-chartjs-with-streaming --ts
ライブラリインストール
それぞれのdevDependenciesやpeerDependencies要チェック
yarn add chart.js react-chartjs-2 chartjs-plugin-streaming
備え付けのmomentが非推奨のためv3からtimeを扱う場合は日時ライブラリとアダプタのインストールが必要(date-fns以外にもluxonも利用可能)
yarn add date-fns chartjs-adapter-date-fns
とりあえず表示させた
tree-shakeableのため明示的にプラグイン等を登録する必要がある
色々書き方あるみたいだけどこれが一番シンプルだった(参考ドキュメント)
import Chart from 'chart.js/auto'
import StreamingPlugin from 'chartjs-plugin-streaming'
Chart.register(StreamingPlugin)
コード
src/pages/_app.tsx
import type { AppProps } from 'next/app'
import '../../styles/chart.css'
import Chart from 'chart.js/auto'
import 'chartjs-adapter-date-fns'
import StreamingPlugin from 'chartjs-plugin-streaming'
Chart.register(StreamingPlugin)

function App({ Component, pageProps }: AppProps) {
  return <Component {...pageProps} />
}

export default App
src/pages/index.tsx
import React from 'react'
import type { NextPage } from 'next'
import { LintHorizontalChart } from '@/components'

const Index: NextPage<void> = () => {
  return <LintHorizontalChart />
}

export default Index
src/components/line-horizontal-chart.tsx
import React from 'react'
import { Line } from 'react-chartjs-2'
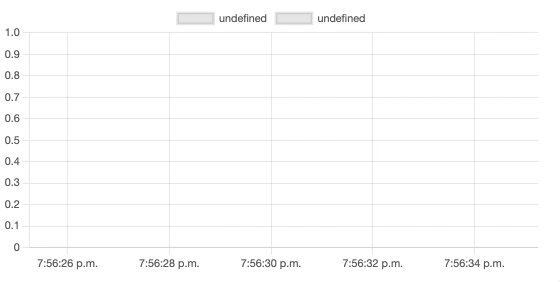
export const LintHorizontalChart = () => {
return (
<div className={'line-chart'}>
<Line
data={{
datasets: [
{
data: [],
},
],
}}
options={{
scales: {
x: {
type: 'realtime',
},
},
}}
/>
</div>
)
}
色々整えて完成 🎉
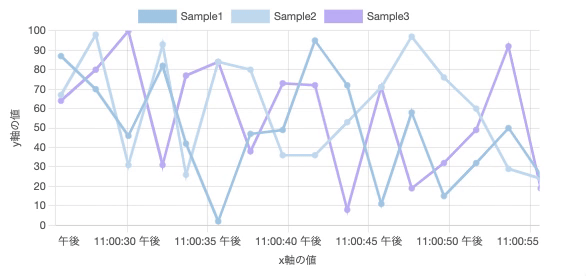
リアルタイムストリーミンググラフの設定は主にoptions.scalsesに書いていく。Chart.jsの拡張プラグインのためリアルタイムストリーミンググラフ以外の設定はChart.jsのドキュメントを見ながら進めていくのがGood!!
タイプはrealtimeに設定する
type: 'realtime'
x軸の時間のロケールの設定(ドキュメントはこちら)
adapters: {
  date: {
    locale: ja,
  },
},
time: {
  unit: 'second',
},
chartjs-plugin-streamingのオプションを設定(ドキュメントはこちら)
refreshのミリ秒ごとにonRefreshのコールバック関数が呼ばれている。onRefresh内ではy軸の値を0~100でランダムに生成。
realtime: {
  duration: 30000,
    delay: 2000,
    refresh: 2000,
    pause: false,
    ttl: undefined,
    onRefresh: (chart) => {
    const now = Date.now()
    chart.data.datasets.forEach((dataset) => {
      dataset.data.push({
        x: now,
        y: Math.floor(Math.random() * 101),
      })
    })
  },
},
デフォルトでのy軸幅は自動で算出されるので揺れが気になる場合はminとmaxを設定するのがよさそう(ドキュメントはこちら)
min: 0,
max: 100,
コード
src/components/line-horizontal-chart.tsx
import React from 'react'
import { Line } from 'react-chartjs-2'
import { ja } from 'date-fns/locale'

export const LintHorizontalChart = () => {
  return (
    <div className={'line-chart'}>
      <Line
        data={{
          datasets: [
            {
              label: 'Sample1',
              borderColor: '#abcde8',
              backgroundColor: '#abcde8',
              data: [],
            },
            {
              label: 'Sample2',
              borderColor: '#c7def1',
              backgroundColor: '#c7def1',
              data: [],
            },
            {
              label: 'Sample3',
              borderColor: '#c4b7f7',
              backgroundColor: '#c4b7f7',
              data: [],
            },
          ],
        }}
        options={{
          scales: {
            x: {
              type: 'realtime',
              title: {
                display: true,
                text: 'x軸の値',
              },
              adapters: {
                date: {
                  locale: ja,
                },
              },
              time: {
                unit: 'second',
              },
              realtime: {
                duration: 30000,
                delay: 2000,
                refresh: 2000,
                pause: false,
                ttl: undefined,
                onRefresh: (chart) => {
                  const now = Date.now()
                  chart.data.datasets.forEach((dataset) => {
                    dataset.data.push({
                      x: now,
                      y: Math.floor(Math.random() * 101),
                    })
                  })
                },
              },
            },
            y: {
              title: {
                display: true,
                text: 'y軸の値',
              },
              min: 0,
              max: 100,
            },
          },
        }}
      />
    </div>
  )
}
不要なものは消したい場合
いらないものがあるときはオプションで設定を変えればだいたい消すことができる。
折り返しのポイントを消す
elements: {
  point: {
    radius: 0,
    hoverRadius: 0,
  },
},
x軸y軸近くのラベルを消す
x: {
  type: 'realtime',
-  title: {
-    display: true,
-    text: 'x軸の値',
-  },
y: {
-  title: {
-    display: true,
-    text: 'y軸の値',
-  },
  min: 0,
  max: 100,
},
凡例やツールチップを消す
plugins: {
  legend: {
    display: false,
  },
  tooltip: {
    enabled: false,
  },
},
コード
src/components/line-horizontal-chart.tsx
import React from 'react'
import { Line } from 'react-chartjs-2'
import { ja } from 'date-fns/locale'

export const LintHorizontalChart = () => {
  return (
    <div className={'line-chart'}>
      <Line
        data={{
          datasets: [
            {
              label: 'Sample1',
              borderColor: '#abcde8',
              backgroundColor: '#abcde8',
              data: [],
            },
            {
              label: 'Sample2',
              borderColor: '#c7def1',
              backgroundColor: '#c7def1',
              data: [],
            },
            {
              label: 'Sample3',
              borderColor: '#c4b7f7',
              backgroundColor: '#c4b7f7',
              data: [],
            },
          ],
        }}
        options={{
          elements: {
            point: {
              radius: 0,
              hoverRadius: 0,
            },
          },
          scales: {
            x: {
              type: 'realtime',
              adapters: {
                date: {
                  locale: ja,
                },
              },
              time: {
                unit: 'second',
              },
              realtime: {
                duration: 30000,
                delay: 2000,
                refresh: 2000,
                pause: false,
                ttl: undefined,
                onRefresh: (chart) => {
                  const now = Date.now()
                  chart.data.datasets.forEach((dataset) => {
                    dataset.data.push({
                      x: now,
                      y: Math.floor(Math.random() * 101),
                    })
                  })
                },
              },
            },
            y: {
              min: 0,
              max: 100,
            },
          },
          plugins: {
            legend: {
              display: false,
            },
            tooltip: {
              enabled: false,
            },
          },
        }}
      />
    </div>
  )
}
さいごに
ラッパーライブラリやライブラリの拡張を扱う際にはいつもドキュメントを探すのに苦戦している気が・・・!!とにかくちゃんと読むことが大事だなとつくづく実感させられます。
Discussion