react-simple-mapsの活用パターン集
はじめに
react-simple-maps は、React で簡単にインタラクティブな地図を作成できるライブラリです。
この記事では react-simple-maps でできることと、その実装方法を解説します:
- 基本的な世界地図の表示
- マーカーの追加や地域のフィルタリング
- インタラクティブ機能
- データ可視化
説明を飛ばしたい方は今回のレポジトリ、Exampleページをご覧ください。
環境構築
必要なパッケージのインストール
今回使用するライブラリをインストールします。
# React用の地図ライブラリ
pnpm add react-simple-maps

# TypeScript用の型定義
pnpm add -D @types/react-simple-maps
地図データの準備
今回は、TopoJSON 形式の地図データを以下の手順で使用します。
-
Natural Earth にアクセス
-
Admin 0 – Countries の「Download countries」をクリックしてダウンロード
-
解凍後、以下の 3 つのファイルを確認:
- ne_10m_admin_0_countries.shp(地理データ本体)
- ne_10m_admin_0_countries.prj(投影法情報)
- ne_10m_admin_0_countries.dbf(属性データ)
-
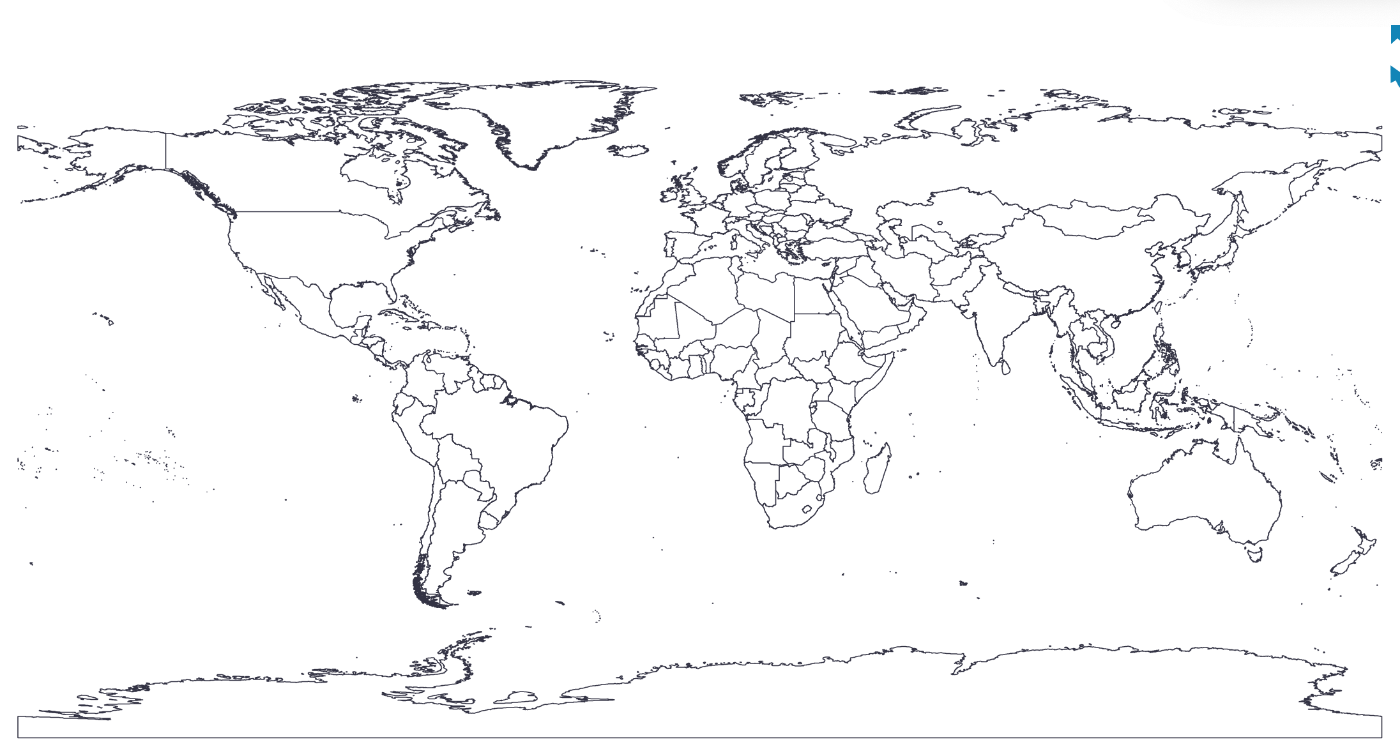
mapshaper で上記3ファイルをまとめてアップロードすると、以下の画像のように世界地図が表示されます
- 右上の「Export」→ File format を「TopoJSON」に変更
- 「save to clipboard」にチェックを入れて Export
- 出力された TopoJSON を
public/world.jsonとして保存

基本的な世界地図の表示
まずはシンプルな世界地図を表示してみます。
'use client'

import React from 'react'
import { ComposableMap, Geographies, Geography } from 'react-simple-maps'

export const WorldMap = () => {
  return (
    <ComposableMap
      projectionConfig={{
        scale: 180,  // 地図の拡大率
      }}
      style={{
        width: '740px',
        height: 'auto',
        backgroundColor: '#f8f9fa',
        border: '1px solid #dee2e6',
      }}
    >
      <Geographies geography="/world.json">
        {({ geographies }) =>
          geographies.map(geo => (
            <Geography
              key={geo.rsmKey}
              geography={geo}
              fill="#C2C4C6"
              stroke="#dee2e6"
              strokeWidth={0.5}
              style={{
                default: {
                  fill: '#C2C4C6',
                  stroke: '#dee2e6',
                  strokeWidth: 0.5,
                  outline: 'none',
                },
                hover: {
                  fill: '#d6d6d6',
                  stroke: '#dee2e6',
                  strokeWidth: 0.5,
                  outline: 'none',
                },
                pressed: {
                  fill: '#c0c0c0',
                  stroke: '#dee2e6',
                  strokeWidth: 0.5,
                  outline: 'none',
                },
              }}
            />
          ))
        }
      </Geographies>
    </ComposableMap>
  )
}
このコードで以下のような地図が表示されます:
-
ComposableMap: 地図全体のコンテナコンポーネント -
Geographies: TopoJSON データを読み込んで地理情報を提供 -
Geography: 各国を表す個別の地理要素

カスタマイズの方法
マーカーを追加する
特定の位置にマーカーを配置して、都市や重要な地点を表示できます。
以下のコードでは、東京都とニューヨークのマーカーを追加しています。
import { Marker } from 'react-simple-maps'

const markers = [
  { name: "Tokyo", coordinates: [139.6503, 35.6762] },
  { name: "New York", coordinates: [-74.006, 40.7128] },
]

// ComposableMap 内に追加
{markers.map(({ name, coordinates }) => (
  <Marker key={name} coordinates={coordinates}>
    <circle r={3} fill="#F00" />
    <text textAnchor="middle" y={-10} style={{ fontSize: 10 }}>
      {name}
    </text>
  </Marker>
))}

特定の地域を非表示にする
geo.propertiesには、国の名前やISOコードなどの情報が含まれているので、これを使います。
例えば南極を非表示にしたい場合、地理データをフィルタリングします:
geographies
  .filter(geo => geo.properties.NAME !== 'Antarctica')
  .map(geo => (
    <Geography key={geo.rsmKey} geography={geo} />
  ))
インタラクティブ機能の追加
同じように、マウスホバーで国名を表示することもできます。onClickでクリックしたときの処理も書けます。
<Geography
  onClick={() => {
    console.log(geo.properties.NAME)
  }}
  onMouseEnter={() => {
    console.log(geo.properties.NAME)
  }}
  onMouseLeave={() => {
    // マウスが離れた時の処理
  }}
/>
国ごとにデータを可視化する
ここからは実際のデータを使って、各国の温室効果ガス排出量を色の濃淡で表現する地図を作成します。
データの準備
Climate Watch から温室効果ガス排出量のデータをダウンロードし、CSV ファイルを準備します。
CSVの読み込み方法についてはここでは省略しますが、詳細はGitHubを参照してください。
各国の地理データとCSVデータをISOコードで照合し、SVGのfillプロパティで排出量に応じた色を適用します。
<Geographies geography="/ne_10m_admin_0_countries.json">
  {({ geographies }) =>
    geographies.map(geo => {
      // CSVデータから該当国を検索(ISO 3166-1 alpha-3 コードで照合)
      const cur = data.find(s => s.iso === geo.properties.ADM0_A3)
      const value = cur ? parseFloat(cur['2019']) : null

      return (
        <Geography
          key={geo.rsmKey}
          geography={geo}
          fill={value !== null ? colorScale(value) : '#e5e7eb'}
          stroke="#fff"
          strokeWidth={0.5}
          style={{
            default: { outline: 'none' },
            hover: { outline: 'none', fill: '#fbbf24' },
            pressed: { outline: 'none' },
          }}
        />
      )
    })
  }
</Geographies>

まとめ
react-simple-mapsを使うことで、簡単にインタラクティブな世界地図を組み込むことができました!
ちなみに
SupabaseダッシュボードのInfrastructureの地図もreact-simple-mapsで実装されていました😊

Discussion