Numo::Gnuplot 使い方メモ
Numo::Gnuplot および Gnuplot で疑問に感じた点や必要に応じて調べた点を書き残している。
Numo.gnuplot は新しいインスタンスを返す?
返さない。
Numo.gnuplot.object_id  # => 500
Numo.gnuplot.object_id  # => 500
gnuplot に渡すコマンドを見える化するには?
Numo.gnuplot.debug_on
または、
Numo.gnuplot do |g|
  g.debug_on
end
とする。後者の場合、局所的な適用に見えるが、全体への適用なので注意する。これは Numo.gnuplot がシングルトンなため。局所的な適用にしたい場合は Numo::Gnuplot.new から使ったほうがよい。
ブロック内にデータが渡せないのはなぜ?
コンテキストが変わっているせい。
@values = [5, 6, 7]
Numo.gnuplot do
  plot @values rescue $!  # => #<Numo::GnuplotError:"\ngnuplot> plot  \n               ^\n         line 0: function to plot expected">
end
スコープを確認すると self が変わっているのがわかる。
self       # => main
@values    # => [5, 6, 7]
Numo.gnuplot do
  self     # => #<Numo::Gnuplot:0x0000000100970d28 @history=["print GPVAL_VERSION", "plot  "], @debug=true, @iow=#<IO:fd 11>, @ior=#<IO:fd 13>, @last_message=["\n", "gnuplot> plot  \n", "               ^\n", "         line 0: function to plot expected\n", "\n"], @gnuplot_version="6.0">
  @values  # => nil
end
たしかにレシーバのコンテキストにすると DSL 風に書けるメリットはある。しかし想定外の挙動に悩まされることも少なくない。このような場合は臨機応変にブロックに引数があればコンテキストを維持するのが一般的だが残念ながらそうなっていない。
Numo.gnuplot do |g|
  g        # => #<Numo::Gnuplot:0x0000000100970d28 @history=["print GPVAL_VERSION", "plot  "], @debug=true, @iow=#<IO:fd 11>, @ior=#<IO:fd 13>, @last_message=["\n", "gnuplot> plot  \n", "               ^\n", "         line 0: function to plot expected\n", "\n"], @gnuplot_version="6.0">
  self     # => #<Numo::Gnuplot:0x0000000100970d28 @history=["print GPVAL_VERSION", "plot  "], @debug=true, @iow=#<IO:fd 11>, @ior=#<IO:fd 13>, @last_message=["\n", "gnuplot> plot  \n", "               ^\n", "         line 0: function to plot expected\n", "\n"], @gnuplot_version="6.0">
  @values  # => nil
end
対策1. ブロックを使わない
g = Numo.gnuplot
g.plot @values
対策2. 自分で tap する
Numo.gnuplot.tap do |g|
  g        # => #<Numo::Gnuplot:0x0000000100970d28 @history=["print GPVAL_VERSION", "plot  ", "plot '-' "], @debug=true, @iow=#<IO:fd 11>, @ior=#<IO:fd 13>, @last_message=[], @gnuplot_version="6.0", @last_data="5\n6\n7\ne\n">
  self     # => main
  @values  # => [5, 6, 7]
end
対策3. モンキーパッチを当てる
def Numo.gnuplot(&block)
  if block
    if block.arity.zero?
      Gnuplot.default.instance_eval(&block)
    else
      yield Gnuplot.default
    end
  else
    Gnuplot.default
  end
end
これで安心してブロックが書ける。
Numo.gnuplot do |g|
  g        # => #<Numo::Gnuplot:0x0000000100970d28 @history=["print GPVAL_VERSION", "plot  ", "plot '-' "], @debug=true, @iow=#<IO:fd 11>, @ior=#<IO:fd 13>, @last_message=[], @gnuplot_version="6.0", @last_data="5\n6\n7\ne\n">
  self     # => main
  @values  # => [5, 6, 7]
end
毎回新しいインスタンスを返すには?
直接 Numo::Gnuplot.new する。
Numo::Gnuplot.new.object_id  # => 500
Numo::Gnuplot.new.object_id  # => 520
これを使えば debug モードを局所化できるし、それ以前に送ったコマンドの状態を気にする必要がなくなる。
最初からデバッグモードを有効にするには?
Numo::Gnuplot.class_eval do
  prepend Module.new {
    def initialize(...)
      super
      debug_on
    end
  }
end
このあたりはインスタンスではなくクラスに対して設定できるとうれしい(願望)。
環境変数 NUMO_GNUPLOT_OUTPUT とは?
出力するファイルを暗黙的に設定できる隠れ機能であらかじめ、
ENV["NUMO_GNUPLOT_OUTPUT"] = "_out.png"
ENV["NUMO_GNUPLOT_OPTION"] = "size 640,480"
としておくと、
Numo::Gnuplot.new.tap do |g|
  g.set terminal: "png", size: [640, 480]
  g.set output: "_out.png"
  # ...
end
を指定したのと同じ挙動になる。ただし、これは開発者がデバッグ用に入れているようにも見えるので積極的には使わない方がよさそう。
GIF を出力したはずなのに PNG になっていた理由は?
次のようにして出力した _out.gif はブラウザで表示されたので疑う余地もなかったが、
Numo::Gnuplot.new.tap do |g|
  g.set output: "_out.gif"
  g.plot [5, 6, 7]
end
中身は PNG になっていた。
`file _out.gif` # => "_out.gif: PNG image data, 640 x 480, 8-bit colormap, non-interlaced\n"
そういうときは set terminal gif を送れば中身も GIF になる。
Numo::Gnuplot.new.tap do |g|
  g.set terminal: "gif"
  g.set output: "_out.gif"
  g.plot [5, 6, 7]
end
`file _out.gif` # => "_out.gif: GIF image data, version 87a, 640 x 480\n"
つまり set output "ファイル名" を書くなら set terminal ファイルフォーマット も一緒に送らないといけない。デフォルトは PNG のようだけど明示的に指定した方がいい。
描画を綺麗にするには?
-  g.set terminal: "png"
+  g.set terminal: "pngcairo"
アンチエイリアスが効いて綺麗になったように見える。
出力したファイルをWEBで使うには?
SVG にする。
Numo::Gnuplot.new.tap do |g|
  g.set terminal: "svg"
  g.set output: "_out.svg"
  g.plot [5, 6, 7]
end
`file _out.svg` # => "_out.svg: SVG Scalable Vector Graphics image\n"
set :output と output は何が違う?
set :output はファイル名を指定する。
Numo::Gnuplot.new.tap do |g|
  g.set output: "_out.png"
end
set output "_out.png"
output は Numo::Gnuplot が用意した命令で指定したファイルに再度出力する。
Numo::Gnuplot.new.tap do |g|
  g.output "_out.png"
end
set terminal png
set output "_out.png"
refresh
         line 0: no active plot; cannot refresh
unset terminal
unset output
拡張子を見て set terminal png も自動で送ってくれるのが便利だがこれも開発者用の機能のように見えるので積極的には使わない方がよさそう。
Rubyっぽく書くには?
set のあとの文字列はそのまま送られるので次のように書ける。
g.set "lmargin at screen 0.1"
しかし、これではラップしてくれているライブラリを使う意味がない。したがって適当に分解して Ruby っぽく書くと前者と同じコマンドが送られる (このへんのこだわりはすごい)。
g.set :lmargin, :at, screen: 0.1
またアンダースコアはスペースになるルールなので構文上の微妙なキーワードはくっつけてもいい。
g.set :lmargin, at_screen: 0.1
なんなら全部くっつけてもよいがやりすぎると旨味がなくなる。
g.set lmargin_at_screen: 0.1
他の例として次の構文はなかなか解釈が難しい。
set border linewidth 1 linecolor rgb "blue"
この場合、次のように書くのがよさそうに思える。
g.set border: { linewidth: 1, linecolor_rgb: "blue" }
しかし border と linewidth の間には「有効にする辺を指定するパラメータ」が入る場合がある。となると border の後に続くパラメータをすべて値と考えるのはおかしいので次のように書いた方がよいようにも思える。
g.set border: 1, linewidth: 1, linecolor_rgb: "blue"
このように綺麗な書き方を追及するとなかなか先に進めなくなる場合があるのであまりに悩む場合はハッシュをやめて、
g.set :border, 1, :linewidth, 1, :linecolor_rgb, "blue"
のように値の羅列とするのでもいいかもしれない。が、true false を値に持つハッシュキーは値が true のときだけ送られるルールなので true, false を指定するときはやっぱりハッシュ形式の方がよいかもしれない。とにかくスマートに書くにはセンスとコツと慣れがいる。
このあたり作者によるデモのコードがたいへん参考になる。
マージンを指定するとレイアウトが変になる原因は?
周囲に 10% の余白を開けようと次のように常識的な書き方をするとレイアウトが壊れる
g.set :lmargin, :at, screen: 0.1
g.set :rmargin, :at, screen: 0.1
g.set :bmargin, :at, screen: 0.1
g.set :tmargin, :at, screen: 0.1
この原因は rmargin と tmargin が対面の端からのコンテンツの領域を指すようになっているためで CSS で言うところのマージンとは解釈がまったく異なる。
こちらの記事の図が非常にわかりやすかった。
したがって周囲に 10% の余白を開けるにはこう書く。
g.set :lmargin, :at, screen: 0.1
g.set :rmargin, :at, screen: 0.9
g.set :bmargin, :at, screen: 0.1
g.set :tmargin, :at, screen: 0.9
リファクタリングするとこうなる。
margin = 0.1
g.set :lmargin, :at, screen: margin
g.set :rmargin, :at, screen: 1.0 - margin
g.set :bmargin, :at, screen: margin
g.set :tmargin, :at, screen: 1.0 - margin
余計わかりにくくなったような気がしないでもない。
割合でない場合は次のように at screen 構文を使わなければいいらしい。
g.set :lmargin, 20
g.set :rmargin, 20
g.set :bmargin, 20
g.set :tmargin, 20
または、
g.set :margin, [20, 20, 20, 20]
w とは?
この w の意味がわからなすぎて怖かったが with のことらしい。
g.plot [5, 6], w: "points"
どこまで短く書けるかですが、他のコマンドやオプション名と被らないところまで短く出来る
なんと。
対話形式以外で略して何もいいことはない (小声)
画像の寸法を指定するには?
g.set terminal: "png", size: [1200, 630]
次のようにハッシュの入れ子で書いてもいい。
g.set terminal: { png: { size: [1200, 630] } }
が、png の指定は必須なのに対して size はオプションなので前者の書き方の方がよさそうな気はする。
アニメーションGIFをつくるには?
animate: true をつけて plot を何度も呼ぶ。
Numo::Gnuplot.new.tap do |g|
  g.set output: "_out.gif"
  g.set terminal: "gif", animate: true
  g.plot [1, 2, 3]
  g.plot [4, 5, 6]
end
GIFのサイズを小さくするには?
optimize: true をつける。
g.set terminal: "gif", animate: true, optimize: true
すると差分アニメーションになってサイズが大幅に小さくなる。
plot 時の例外を回避するには?
次のように optimize が有効かつ plot で同じ値を出力した場合、Gnuplot は警告を出すが Numo::Gnuplot は警告として認識できず、例外を出してしまう。
Numo::Gnuplot.new.tap do |g|
  g.set output: "_out.gif"
  g.set terminal: "gif", animate: true, optimize: true
  g.plot [1, 2, 3] rescue $!  # => nil
  g.plot [1, 2, 3] rescue $!  # => #<Numo::GnuplotError:"\nGD Warning: one parameter to a memory allocation multiplication is negative or zero, failing operation gracefully">
end
対策1. モンキーパッチで回避する
module Numo
  class Gnuplot
    def run(s, data = nil)
      res = send_cmd(s, data)
      message = res.join
      if !message.empty?
        if message.match?(/warning:|frames in animation sequence/i)
          return
        end
        kernel_raise GnuplotError, message
      end
      nil
    end
  end
end
対策2. plot に渡した一つ前のデータの履歴を持って、それと比べて同じであれば plot をスキップする
対策3. (一時的であれば) optimize: false とする
run を実行したときの例外を回避するには?
直接 run を実行して例外になってしまう場合は send に置き換えると無駄に例外を飛ばさなくなる。
g.run "set mxtics 0"
↓
g.send "set mxtics 0"
アニメーション速度を最速にするには?
g.set terminal: "gif", animate: true, delay: 2
delay の最小値である 1 のとき最速の 100 fps になるはずだが 2 の 50 fps の方が速くなる。
これはブラウザ依存の問題でこちらのサイトが詳しい。
フレームレートが高すぎると安全圏に戻されて逆に遅くなっているのがわかる。
シンプルな表示にするには?
g.set :nokey                    # 右上のボックスを消す
g.set :noborder                 # 枠線を消す
g.set :notics                   # 目盛りを消す
周囲のマージンを切るには?
g.set :margin, [0, 0, 0, 0]
意味を左上に表示するには?
g.set key: "left top", spacing: 2
二行ある場合に日本語だとくっついて読みにくいので最低 2 のスペースをあけておく。
Y座標の表示領域の自動調整を禁止するには?
自分で範囲を決めると目盛りを固定できる。
g.set yrange: 0..100
棒グラフの左端の棒が見切れる場合の対処法は?
左端の開始位置を -1 からにする。
棒が 12 個があると仮定した場合の例:
g.set xrange: -1..12
最小の棒の高さが消える原因は?
範囲の自動調整によって底辺が最小から始まるため。
底辺を「最小 - 1」から始めると見える。
g.set yrange: (values.min - 1)..values.max
大きな棒が天井にくっつくのを回避するには?
天井を「最大 + 1」にする。
g.set yrange: (values.min - 1)..(values.max + 1)
X, Y 軸を描画するには?
g.set :zeroaxis
(0, 0) を原点とした関数を描画するときに指定しておくとわかりやすくなる。
直接コマンドを送るには?
Numo::Gnuplot がサポートしてなさそうな命令は run で送れる。
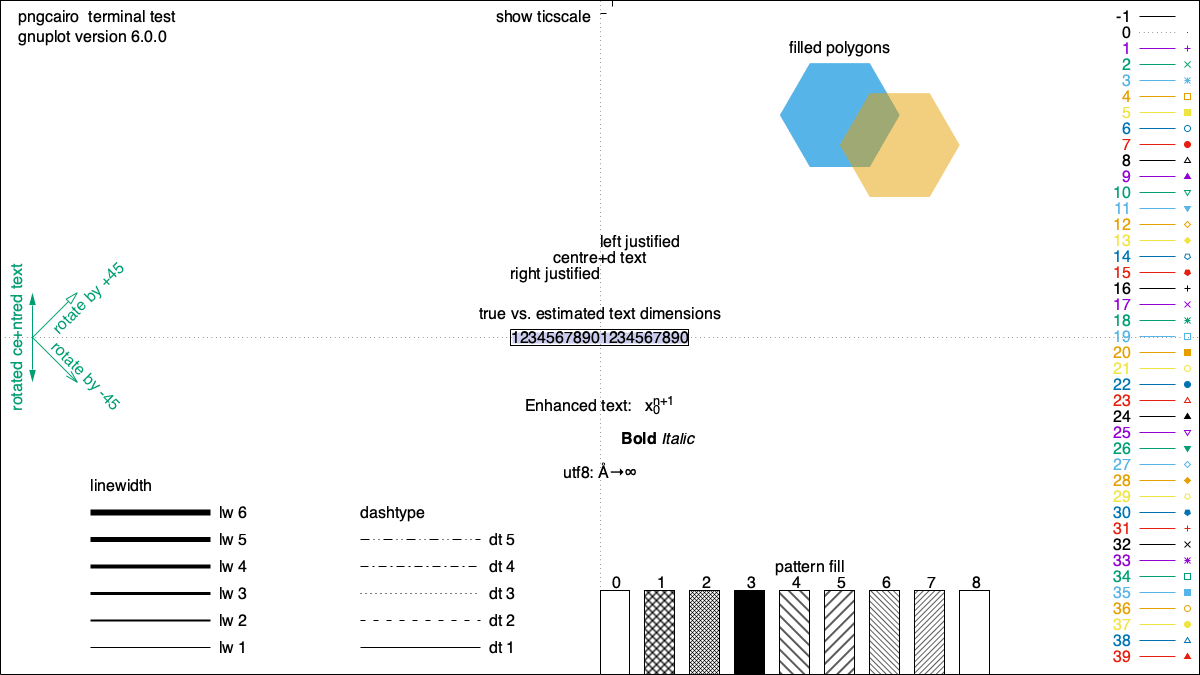
test 命令でサンプル画像を生成する例:
Numo::Gnuplot.new.tap do |g|
  g.set terminal: "pngcairo", size: [1200, 675]
  g.set output: "images/gnuplot_test.png"
  g.run "test"
end

色を hsv2rgb 形式で書くとエラーになる原因は?
g.plot [5, 6, 7], with: "boxes", fc_rgb: "skyblue"
となっているとき色名の部分を hsv2rgb 形式に置き換えるとエラーになる。
g.plot [5, 6, 7], with: "boxes", fc_rgb: "hsv2rgb(0.0, 0.0, 0.5)" rescue $! # => #<Numo::GnuplotError:"\ngnuplot> plot '-' with boxes fc rgb \"hsv2rgb(0.0, 0.0, 0.5)\"\n ^\n line 0: unrecognized color name and not a string \"#AARRGGBB\" or \"0xAARRGGBB\"\n :\n">
的を得ていないエラーメッセージだが要は hsv2rgb を文字列として書くなということだろう。しかし Numo::Gnuplot は rgb に対する値を特別扱いし、文字列としてしまうのでいったん詰んだ……ように思えたが裏技が用意されていた。_nq をつけると文字列化を回避できるらしい。
g.plot [5, 6, 7], with: "boxes", fc_rgb_nq: "hsv2rgb(0.0, 0.0, 0.5)" # => nil
試行錯誤しているとき fc_rgb を fc_rgbcolor に変更したら通ったが、これはたまたま Numo::Gnuplot の不具合で「文字列にしとくキーのリスト」をすり抜けただけなのでこれに依存させてはいけない。
g.plot [5, 6, 7], with: "boxes", fc_rgbcolor: "hsv2rgb(0.0, 0.0, 0.5)" # => nil
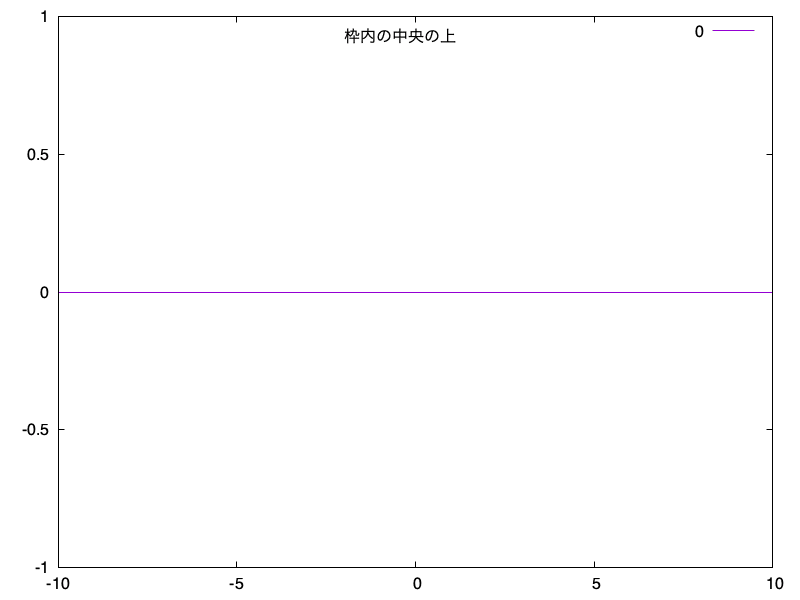
文字列を配置するには?
Numo::Gnuplot.new.tap do |g|
  g.set terminal: "pngcairo", size: [800, 600]
  g.set output: "images/text_embed.png"
  g.set label: "枠内の中央の上", center: true, at_screen: [0.5, 0.94]
  g.plot "0"
end

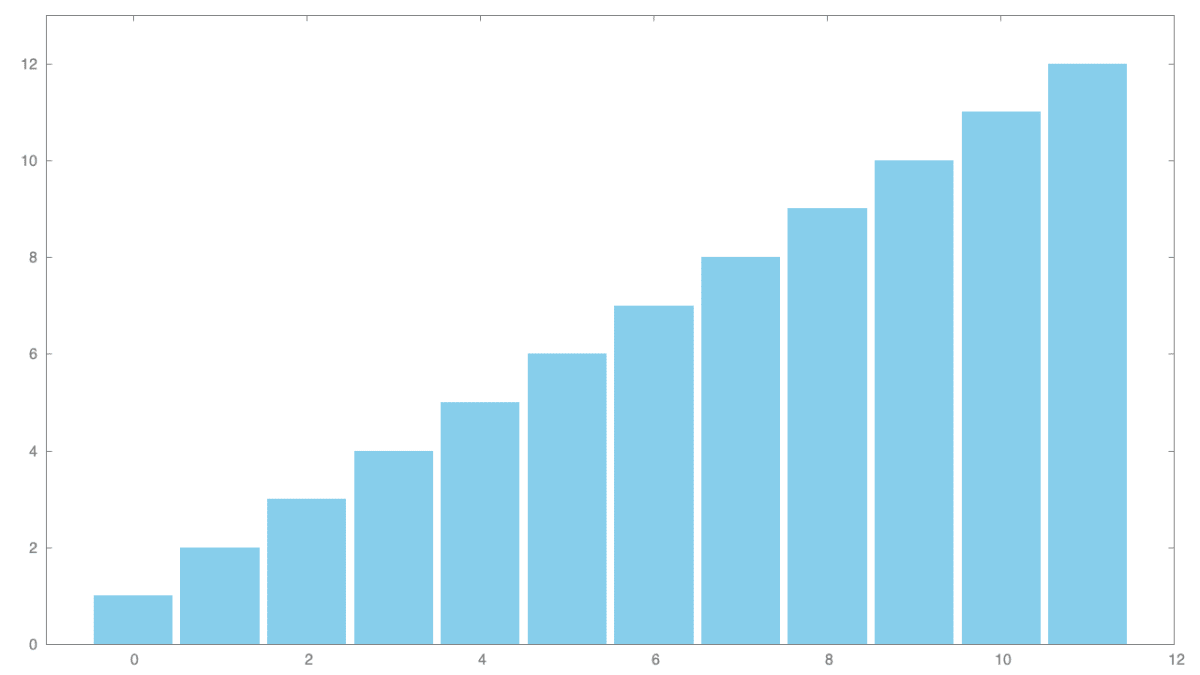
配列をすぐ視覚化するには?
class Array
  def visualize
    if false
      # テンポラリに干渉しなさそうなファイルを生成する場合
      require "pathname"
      require "tmpdir"
      require "securerandom"
      output_file = Pathname(Dir.tmpdir).join("#{SecureRandom.hex}.png")
    else
      output_file = "images/array_visualize.png"
    end

    Numo::Gnuplot.new.tap do |g|
      g.set terminal: "pngcairo", size: [1280, 720]
      g.set output: output_file.to_s
      g.set boxwidth: "0.9 relative"
      g.set :border, linecolor_rgbcolor: "hsv2rgb(0.0, 0.0, 0.5)"
      g.set :nokey
      g.set style: :fill_solid
      g.set xrange: -1...size
      g.set yrange: (min - 1)..(max + 1)
      g.plot self, with: "boxes", fc_rgb: "skyblue"
    end

    system "open -a 'Google Chrome' #{output_file}"
  end
end
(1..12).to_a.visualize

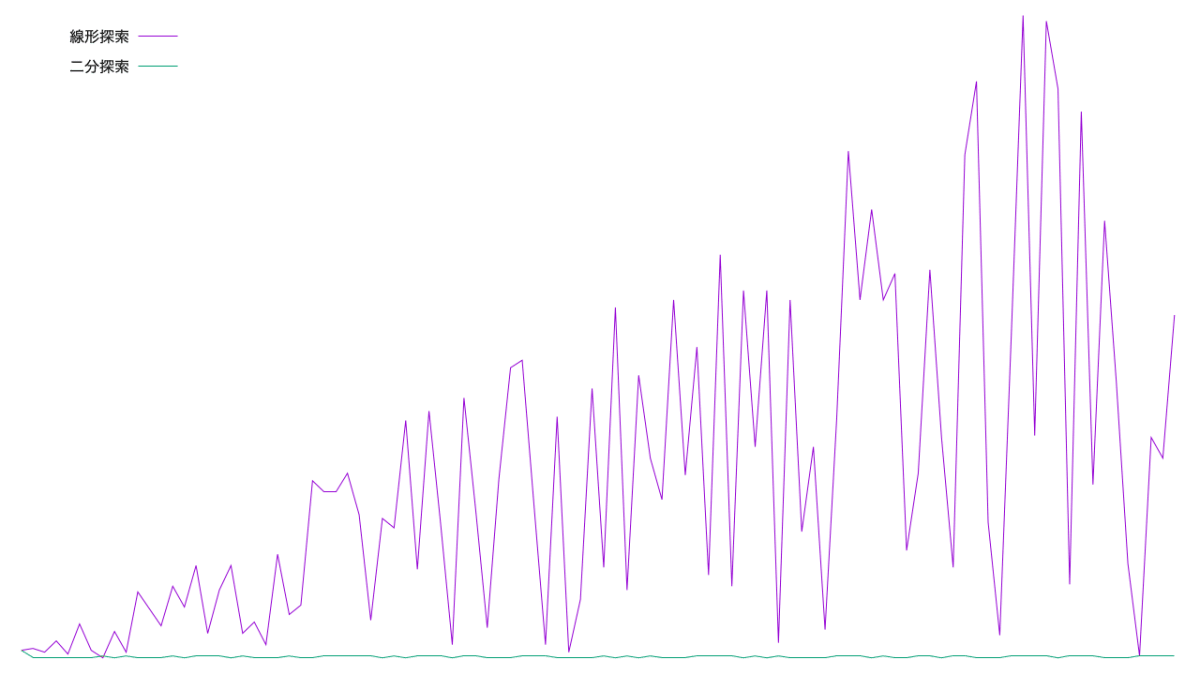
二つのラインチャートを作るには?
v1 = []
v2 = []
(1..10000).step(100) do |i|
  n = i
  a = n.times.to_a
  v = a.sample
  v1 << Benchmark.ms { a.find { |e| e == v } }
  v2 << Benchmark.ms { a.bsearch { |e| e >= v } }
end

Numo::Gnuplot.new.tap do |g|
  g.set terminal: "pngcairo", size: [1280, 720]
  g.set output: "images/lines.png"
  g.set key: "left top", spacing: 2
  g.set :noborder
  g.set :notics
  g.set :style, :data, "lines"
  g.plot *[
    [v1, title: "線形探索"],
    [v2, title: "二分探索"],
  ]
end
plot に2つ分渡せば2つ出る。

指定の座標に点を打つには?
これは (1, 3) と (2, 4) に点を打つ例ではない。実際は (1, 2) と (3, 4) に点を打つ。
Numo::Gnuplot.new.tap do |g|
  g.set terminal: "pngcairo", size: [800, 256]
  g.set output: "images/plot_xy.png"
  g.set :nokey
  g.set xrange: 0..5
  g.set yrange: 0..5
  g.plot [1, 3], [2, 4], with: :points, pointtype: 7, pointsize: 4
end

plot map(&:first), map(&:last) のように書けばいいのかもしれないがどうも不自然に感じる。plot の引数で x の指定をしない普段の仕様との辻褄が合わないのだろうか。他の Gnuplot ラッパーではどのような仕様になっているのか気になる。
何かスマートな方法があってほしいと思うのだけど結局ファイルから読む以外の方法がわからない。しょうがないので、とりあえず自力でコマンドを発行してみたがどうだろうか。これなら一応は (x, y) のペアで記述できる。しかしラッパーを使う意味がなくなってくる。
g.run "plot '-' with points pointtype 7 pointsize 5\n1 2\n3 4\ne"
Gnuplot 全般について知るには?
ググりまくるよりこちらを丁寧に読む。
Gnuplot の拡張子は?
わからない。ChatGPT に聞くと .gp または .plt だというが、.gp でググると Guiter Pro が出てくるし、.plt でググると AutoCAD がでてくる。
Gnuplot を単体でテストするには?
スクリプトファイル主体なら
#!/usr/bin/env gnuplot
set terminal png
set output "_out.png"
plot '-'
5
6
7
e
!open -a 'Google Chrome' _out.png
シェルスクリプトとして
#!/bin/sh
cat <<'EOS' | gnuplot
set terminal png
set output '_out.png'
plot '-'
5
6
7
e
EOS
open -a 'Google Chrome' _out.png
Ruby から
require "open3"
stdout, stderr, status = Open3.capture3("gnuplot", stdin_data: <<~EOS)
set terminal png
set output "_out.png"
plot '-'
5
6
7
e
EOS
system "open -a 'Google Chrome' _out.png"
set terminal で指定できる種類を確認するには?
gnuplot コマンドを実行して set terminal を送ればその後に指定できる値が列挙される。
gnuplot -e "set terminal"
正しい情報を得るには?
正確な情報を得るためになるべく本家を参照する。
Discussion