【QuickSight】Highchatrsのサンプルを動かしてみる。
QuickSightのアップデートが出てきましたね。
その中でQuickSightでHightchatrsが使用できるよ。というもの。こりゃすげえや。ということで試してみました。
参考サイト
Highchatrsのサンプルがいっぱい
QuickSightでの実例サンプル
今回は↑この中からカレンダーヒートマップを試してみたいと思います。

ちなみにこのDemocentralでは、画面上の左側の分析アイコンを押すと実際のQuickSight画面になるのですごく参考になります。おすすめです。

↓

サンプルデータセット
chatGPTに、

こんな感じに投げたデータを使用しています。

やってみた。
ビジュアルを追加するで、Hightchatrs visualを追加します。

そうすると、画面上にコードが打てるものがでてくるので、その中で今回使用するカレンダーヒートマップのJSONをコピーしてAPPLY CODEを押して反映させます。当然データはありませんが、カレンダーっぽいものが出てきます。

後はデータを入れていくんですが、サンプルを見てみると何やらCalendar Day IndexとCalendar Week IndexとDay Of Monthいう計算フィールドを作成しているみたいなので、まったく同じものを作成しておきます。

//Index that maps Sunday to 0, Monday to 1, Saturday to 6
extract('WD',date)-1
//Get the week number, rounded down, without any decimals
floor(
    //Get an index starting from first Sunday (top left cell) in the calendar display
    (
        //Get the day index for first day of Month; Sunday = 0, Monday =1 ..Saturday = 6
        extract('WD',truncDate('MM',{date}))-1
        +
        //Get day of month converted to start at 0
        extract('DD',{date})-1
    )
    /
    //Divide above index by 7 to convert to weeks
    7
)
extract('DD',{date})
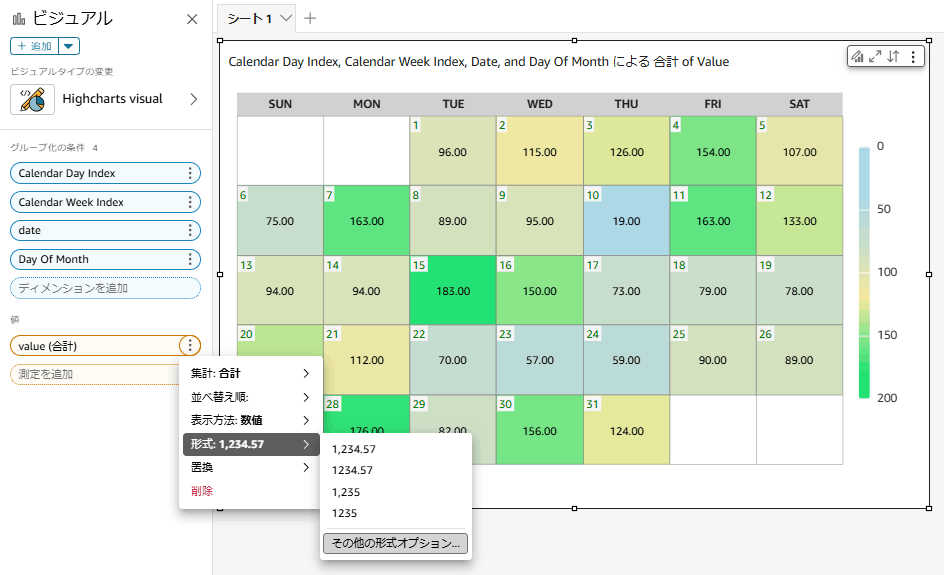
そんでもってサンプルと同じように、ディメンションを配置します。

なんかぽいものが出てきました。すごいですね。いろいろ出来そう。
フィルターとかのQuickSightの機能をいじってみる
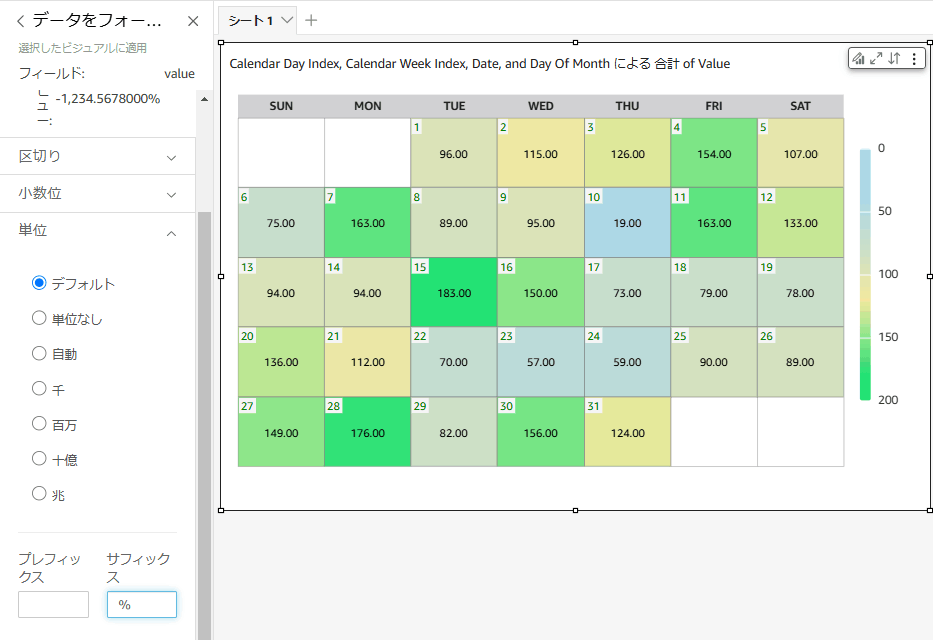
値の小数点とかサフィックスとか
いつも通り、値の小数点とかをいじろうとするとそれは反映されませんでした。


集計方法を変更する
値の集計方法を合計から平均へ変更するとかは反映されます。

フィルター
フィルターとかは当たり前ですが反映します。

コードの中の話をいろいろいじってみる。
dataの話
実際のデータをどのようにとってきているかいろいろ見ていると、seriesの中のdataがそれっぽい。
"data": [
        "map", //Shaping data to below specified JSON format.
        ["getColumn", 0, 1, 2, 3, 4],
        {
          "x": ["get", ["item"], 0], //Calendar Day Index
          "y": ["get", ["item"], 1], //Calendar Week Index
          "date": ["get", ["item"], 2], //Order Date
          "dayOfMonth": ["get", ["item"], 3], //Day Of Month
          "value": ["get", ["item"], 4] //Sales
        }
      ],
例えば、ディメンションの配置を入れ替えてみると、こんな感じで辺になるので、ディメンションの配置順がgetColumnするときに重要になってくる。(dateとDay Of Monthの順番を入れ替えてみた例)

表記的な話
    {
      "enabled": true,
      "format": "{point.value:,.2f}",
      "color": "black",
      "style": {
        "textOutline": "none",
        "fontWeight": "normal",
        "fontSize": "12px"
      }
    }
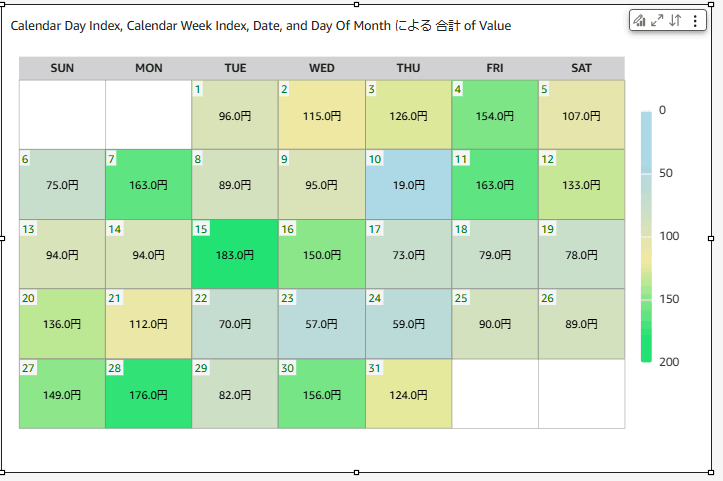
サンプルでは、小数点2桁まで表示するように、{point.value:,.2f}となっているところを、{point.value:,.1f}円にしてみると変わったりする。

HTML的な話
  "xAxis": {
    "categories": ["Sun", "Mon", "Tue", "Wed", "Thu", "Fri", "Sat"],
    "min": 0,
    "max": 6,
    "opposite": true, //Position X axis on top side of chart
    "lineWidth": 26, //X axis line width
    "offset": 13, //Shift the axis line up by half the width to avoid overlap with heatmap.
    "lineColor": "rgba(27, 26, 37, 0.2)",
    "gridLineWidth": 0.5,
    "gridLineColor": "Grey",
    "labels": {
      "y": 20, //Shift X axis label down to position over axis line.
      "style": {
        "textTransform": "uppercase",
        "fontWeight": "bold"
      }
    }
  },
上記のサンプルを、
  "xAxis": {
-    "categories": ["Sun", "Mon", "Tue", "Wed", "Thu", "Fri", "Sat"],
+    "categories": [
+      "月",
+      "火",
+      "水",
+      "木",
+      "金",
+      "<span style='display: inline-block; width: 100px; background-color: rgba(173, 216, 230, 0.7); color: white; text-align: center;'>土</span>",
+      "<span style='display: inline-block; width: 100px; background-color: rgba(255, 182, 193, 0.7); color: white; text-align: center;'>日</span>"
    ],
    "min": 0,
    "max": 6,
    "opposite": true, //Position X axis on top side of chart
    "lineWidth": 26, //X axis line width
    "offset": 13, //Shift the axis line up by half the width to avoid overlap with heatmap.
    "lineColor": "rgba(27, 26, 37, 0.2)",
    "gridLineWidth": 0.5,
    "gridLineColor": "Grey",
    "labels": {
      "y": 20, //Shift X axis label down to position over axis line.
+     "useHTML": true, // HTMLを有効にする
      "style": {
        "textTransform": "uppercase",
        "fontWeight": "bold"
      }
    }
  },
こんな感じに変更すると、

みたいに変わったりできる。
さいごに
今回のアップデートでカスタマイズ性が跳ね上がった感じがしています。現状使用できないものがあったりもするみたいですが(function()など)、ある程度やりたいことはできちゃうようになっちゃったのではないでしょうか。
Discussion