callgrindに関するメモ
コード解析ツールであるcallgrindについて調べる。
背景
C/C++で書かれた巨大なコードを読む時において、関数の呼び出し関係を追いながら全体を把握することが多い。そのため関数呼び出し関係を可視化してくれるツールがあれば作業が捗る。このようなツールの一つがcallgrindである(はず)。
callgrindに期待すること:関数の呼び出し関係(コールグラフ)を可視化
これからやること
- install方法(aptでいいはず)
-
手軽なサンプルと例
- 使い方
- callgrindから得られる生成物
確認すること
-
-gオプションは必要?
→コールグラフを表示するだけなら要らなそう。-
-gなしの場合の挙動
→ コールグラフは表示される。ただ、「SourceCode」タブに情報がでなくなる。
-
-
解析時間は?
→ 50行未満の小さなプログラムに対してはすぐに終わる。
確認すること(優先順位低い)
- multi-thread/processの場合の挙動
- 起動済みのプロセスにattach可能?
これでinstallできた。
[@ubuntu ~]$ sudo apt-get install valgrind
[@ubuntu ~]$ valgrind --version
valgrind-3.18.1
ソースコードからコンパイルする場合は以下の通り。
ついでに可視化ツールもインストールした。
[@ubuntu tmp]$ sudo apt install kcachegrind
適当なプログラムを作成し、callgrindを使ってみる。
#include <iostream>

void func_1stCallee();
void func_2ndCalleeA();
void func_2ndCalleeB();
void func_3rdCallee();

void func_1stCallee()
{
    std::cout << __PRETTY_FUNCTION__ << " started" << std::endl;
    func_2ndCalleeA();
    func_2ndCalleeB();
    std::cout << __PRETTY_FUNCTION__ << " end" << std::endl;
}

void func_2ndCalleeA()
{
    std::cout << __PRETTY_FUNCTION__ << " started" << std::endl;
    // do nothing
    std::cout << __PRETTY_FUNCTION__ << " end" << std::endl;
}

void func_2ndCalleeB()
{
    std::cout << __PRETTY_FUNCTION__ << " started" << std::endl;
    func_3rdCallee();
    std::cout << __PRETTY_FUNCTION__ << " end" << std::endl;
}

void func_3rdCallee()
{
    std::cout << __PRETTY_FUNCTION__ << " started" << std::endl;
    // do nothing
    std::cout << __PRETTY_FUNCTION__ << " end" << std::endl;
}

int main()
{
    std::cout << __PRETTY_FUNCTION__ << " started" << std::endl;
    func_1stCallee();

    std::cout << __PRETTY_FUNCTION__ << " end" << std::endl;
    return 0;
}
$ g++ test.cpp && ./a.out
int main() started
void func_1stCallee() started
void func_2ndCalleeA() started
void func_2ndCalleeA() end
void func_2ndCalleeB() started
void func_3rdCallee() started
void func_3rdCallee() end
void func_2ndCalleeB() end
void func_1stCallee() end
int main() end
上記のプログラムに対して、callgrindを実行した。すると、実行ディレクトリの直下に
callgrind.out.4954というファイルが生成された。
$ g++ test.cpp
$ valgrind --tool=callgrind ./a.out
==4954== Callgrind, a call-graph generating cache profiler
==4954== Copyright (C) 2002-2017, and GNU GPL'd, by Josef Weidendorfer et al.
==4954== Using Valgrind-3.18.1 and LibVEX; rerun with -h for copyright info
==4954== Command: ./a.out
==4954==
==4954== For interactive control, run 'callgrind_control -h'.
int main() started
void func_1stCallee() started
void func_2ndCalleeA() started
void func_2ndCalleeA() end
void func_2ndCalleeB() started
void func_3rdCallee() started
void func_3rdCallee() end
void func_2ndCalleeB() end
void func_1stCallee() end
int main() end
==4954==
==4954== Events    : Ir
==4954== Collected : 2321442
==4954==
==4954== I   refs:      2,321,442
生成されたファイルをkcachegrindツールで見てみる。
[@ubuntu ~]$ kcachegrind /tmp/callgrind.out.4954
すると、以下の様に func_*_Callee関数の呼び出し関係が表示された(右下にある)。
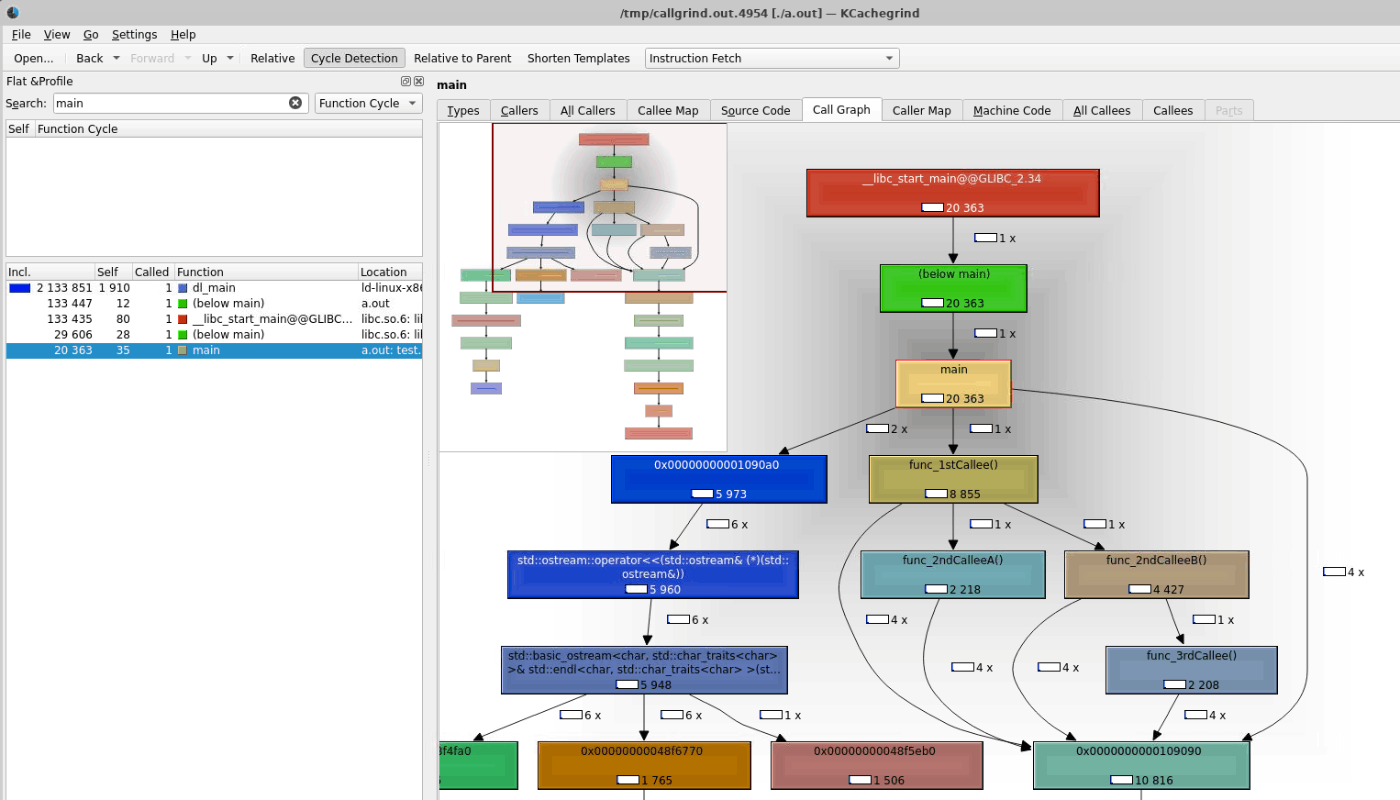
ただ、自分が定義した関数以外にも様々な関数が表示されていることがわかる。これはこれで便利であるが、表示される関数の量が多すぎるため、最初に開いた時は自分の定義した関数が見つけられずに戸惑った。
まず最初に、左上の「Search:」欄に「main」と入力して、自分の関数を見つけると全体像が把握しやすい。
-gなしでも、コールグラフは表示された。ただ、Source Codeタブには何も表示されなかった。
g++ -O2 test.cpp -o executable_without_debuginfo
valgrind --tool=callgrind ./executable_without_debuginfo
kcachegrind /tmp/callgrind.out.7258
表示される関数が多すぎるからフィルターできないだろうか...。
のコメントにはいくつか有用そうな提案があった。
-> create a suppression file https://valgrind.org/docs/manual/manual-core.html
If you're using an error-detection tool, Valgrind may detect errors in system libraries, for example the GNU C or X11 libraries, which you have to use. You might not be interested in these errors, since you probably have no control over that code. Therefore, Valgrind allows you to selectively suppress errors, by recording them in a suppressions file which is read when Valgrind starts up. The build mechanism selects default suppressions which give reasonable behaviour for the OS and libraries detected on your machine. To make it easier to write suppressions, you can use the --gen-suppressions=yes option. This tells Valgrind to print out a suppression for each reported error, which you can then copy into a suppressions file.
-> https://stackoverflow.com/questions/7761448/filter-calls-to-libc-from-valgrinds-callgrind-output
2番目のstackoverflowの回答に従ってcallgrind出力ファイルを編集することでフィルターするのが一番楽かもしれない。
上記のstackoverflow回答に記載されているperfスクリプトを使ってみる。
$ g++ test.cpp -o a.out
$ ./a.out
int main() started
void func_1stCallee() started
void func_2ndCalleeA() started
void func_2ndCalleeA() end
void func_2ndCalleeB() started
void func_3rdCallee() started
void func_3rdCallee() end
void func_2ndCalleeB() end
void func_1stCallee() end
int main() end

$ valgrind --tool=callgrind --dump-instr=yes --compress-pos=no   --compress-strings=no --callgrind-out-file=/tmp/callgrind.out ./a.out
==54948== Callgrind, a call-graph generating cache profiler
==54948== Copyright (C) 2002-2017, and GNU GPL'd, by Josef Weidendorfer et al.
==54948== Using Valgrind-3.18.1 and LibVEX; rerun with -h for copyright info
==54948== Command: ./a.out
==54948==
==54948== For interactive control, run 'callgrind_control -h'.
int main() started
void func_1stCallee() started
void func_2ndCalleeA() started
void func_2ndCalleeA() end
void func_2ndCalleeB() started
void func_3rdCallee() started
void func_3rdCallee() end
void func_2ndCalleeB() end
void func_1stCallee() end
int main() end
==54948==
==54948== Events    : Ir
==54948== Collected : 2323009
==54948==
==54948== I   refs:      2,323,009

$ ./perf_script_copied_from_stackoverflow.pl /tmp/callgrind.out > /tmp/callgrind.out.edited # https://stackoverflow.com/questions/7761448/filter-calls-to-libc-from-valgrinds-callgrind-output
$ kcachegrind /tmp/callgrind.out &
$ kcachegrind /tmp/callgrind.out.edit &
左がオリジナルの出力(callgrind.out)・右がperlスクリプト適用後の出力(callgrind.out.edit)である。
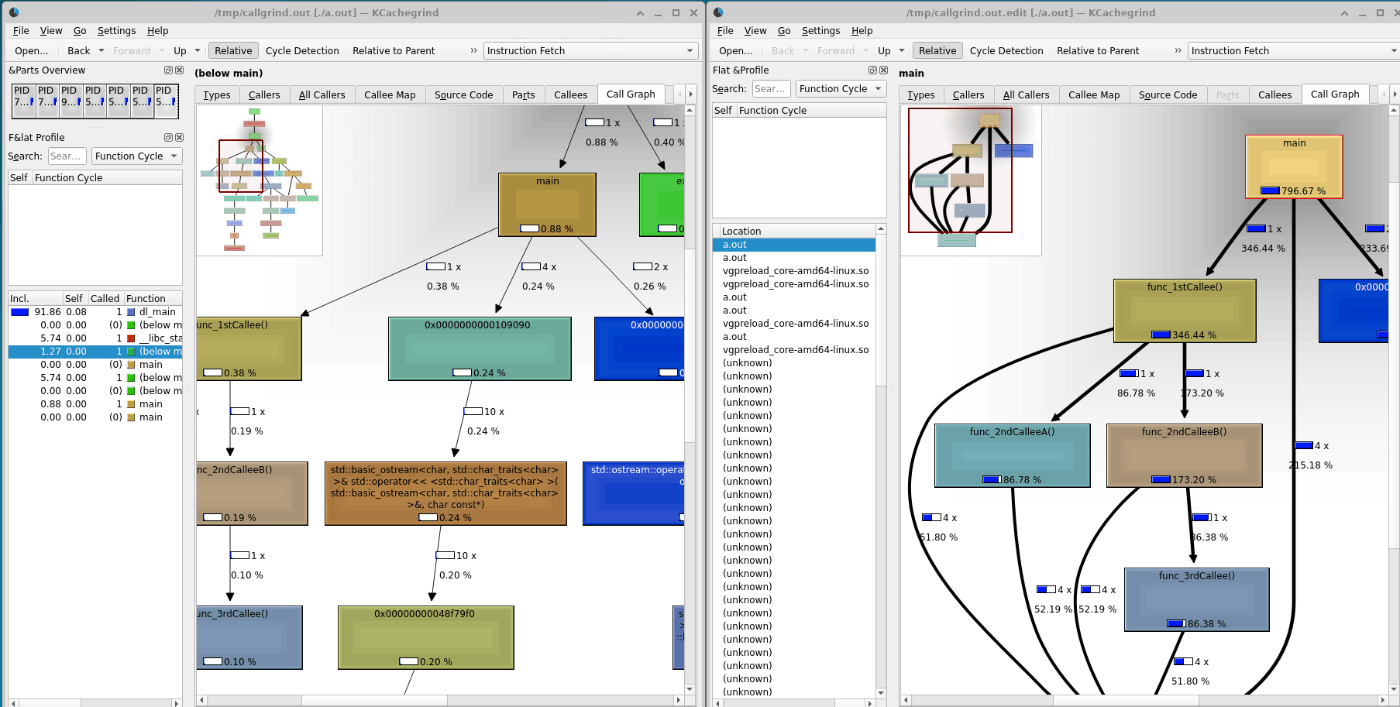
Callgraph左上にある全体像を見ると、左と右で木構造の要素数が大きく異なることがわかる。
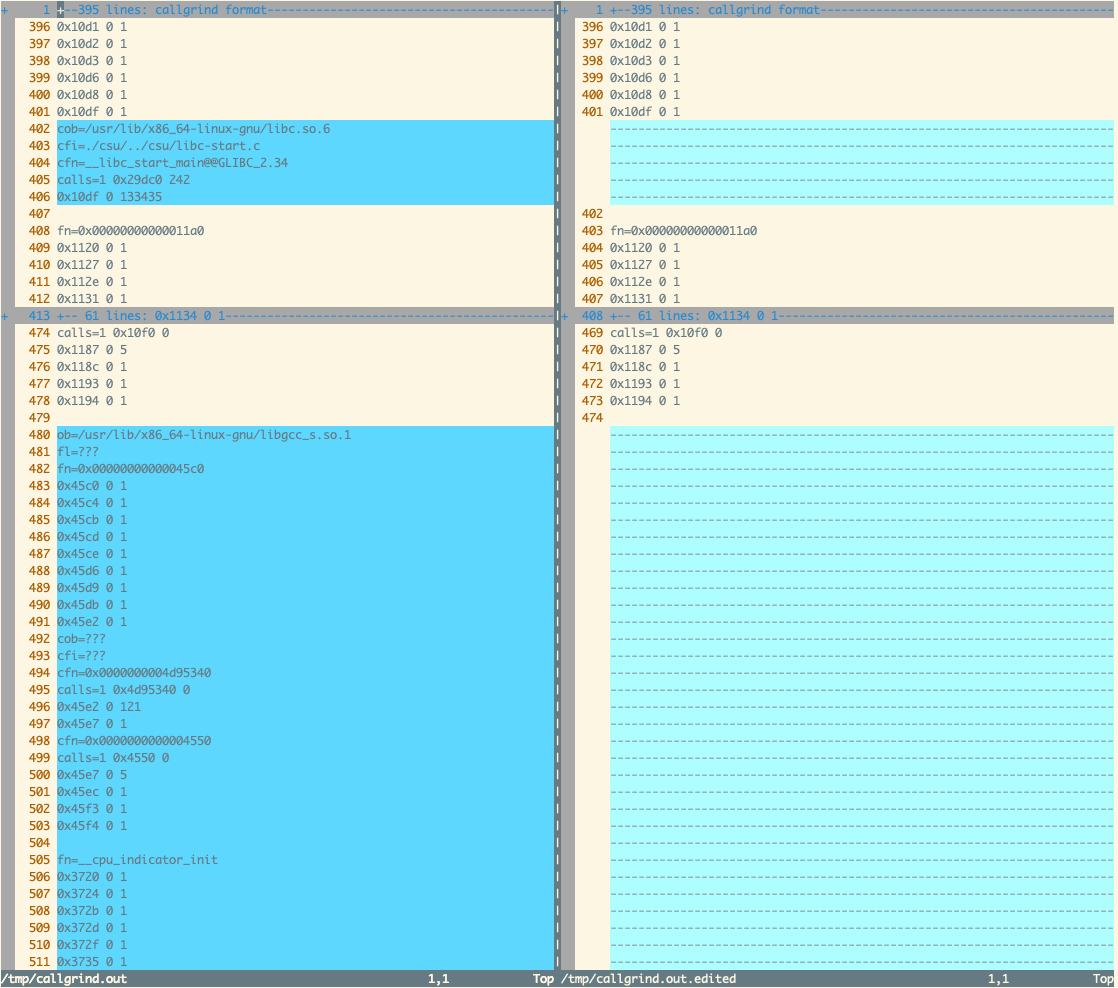
vim-diffで比較してみると、perlスクリプト適用後の出力ファイルは一部のデータが削除されていることがわかる。なお、左がオリジナルの出力(callgrind.out)・右がperlスクリプト適用後の出力(callgrind.out.edit)である。
$ vimdiff /tmp/callgrind.out /tmp/callgrind.out.edited
pythonで書き直してみた。
#!/usr/bin/env python3

import sys
import re
from itertools import dropwhile

def not_startWith_ob(line): return not line.startswith('ob=')
def not_startWith_0x(line): return not line.startswith('0x')
def     startWith_0x(line): return line.startswith('0x')

# ref:
# https://stackoverflow.com/questions/48309143/skip-lines-until-the-next-block-in-a-text-file-if-a-condition-is-met-in-python
# https://fgshun.hatenablog.com/entry/20091203/1259807808

def filterAndPrint(filepath):
    with open(filepath, 'r') as f:
        while True:
            line=next(f, None)
            if line == None:
                break
            elif re.match(r"^ob=/(?:usr/)?lib/",line):
                # skip the entire ob= section we don't need.
                # this means to skip until the next line starting with "ob=" appears.
                f = dropwhile(not_startWith_ob, f)
            elif re.match(r"^cob=/(?:usr/)?lib",line):
                # skip until we find a line starting with "0x"
                f = dropwhile(not_startWith_0x, f)
                # skip all lines that start with "0x"
                f = dropwhile(startWith_0x, f)
            else:
                print(line.strip())

def main():
    if len(sys.argv) == 2:
        filterAndPrint(sys.argv[1])
    else:
        print('Error. Usage:\n$', sys.argv[0], '<callgrind-output-file-path>')

if __name__ == "__main__":
    main()
使い方
$ g++ test.cpp -o a.out
$ valgrind --tool=callgrind --dump-instr=yes --compress-pos=no   --compress-strings=no --callgrind-out-file=/tmp/callgrind.out ./a.out
==72167== Callgrind, a call-graph generating cache profiler
==72167== Copyright (C) 2002-2017, and GNU GPL'd, by Josef Weidendorfer et al.
==72167== Using Valgrind-3.18.1 and LibVEX; rerun with -h for copyright info
==72167== Command: ./a.out
==72167==
==72167== For interactive control, run 'callgrind_control -h'.
int main() started
void func_1stCallee() started
void func_2ndCalleeA() started
void func_2ndCalleeA() end
void func_2ndCalleeB() started
void func_3rdCallee() started
void func_3rdCallee() end
void func_2ndCalleeB() end
void func_1stCallee() end
int main() end
==72167==
==72167== Events    : Ir
==72167== Collected : 2323009
==72167==
==72167== I   refs:      2,323,009

# 上のpythonスクリプト
$ ./filteringCallgrindOutput.py /tmp/callgrind.out > /tmp/callgrind.out.filtered
$ kcachegrind /tmp/callgrind.out.filtered