はじめに
先日書いたこちらのブログで実施した内容を今回は Elastic Agent で実施してみました。
前提
・Logstash を Elastic Agent に置き換えただけでその他のシステム環境は前回の記事と同じです。
・Elastic Agent は Logstash が稼働していた Azure VM にインストールしました。
・Elastic Agent で 同じ TCP1514 をしているため、Logstash は停止しています。
・Elastic Agent のインストールはスタンドアローン方式を利用しています。
利用環境
各ソフトウェアのバージョンは以下の通りです。
| Product / Service | Version |
|---|---|
| LANSCOPE Endpoint Manager | 9.4.7.0 |
| Windows Server OS | Windows Server 2019 Datacenter |
| .NET Framework | 4.8.1 |
| MS SQL Server | SQL Server 2019 Express Edition |
| MS SQL Server Management Studio | 18.12.1 |
| Elastic Agent | 8.17.3 |
| Linux OS | RHEL 8.10 |
| Elastic Cloud | 8.17.2 (Subscription level: Gold) |
| Azure Region | (Asia Pacific) Japan East |
| Windows Client OS | Windows 11 Pro 23H2 |
| macOS | Sequoia 15.3.1 |
【構成図】
・LANSCOPE 管理サーバーから Elastic Agent には TCP 1514 で Syslog 通信します。
・Elastic Agent の Custom TCP Log integration [2] を使って Syslog を受信します。
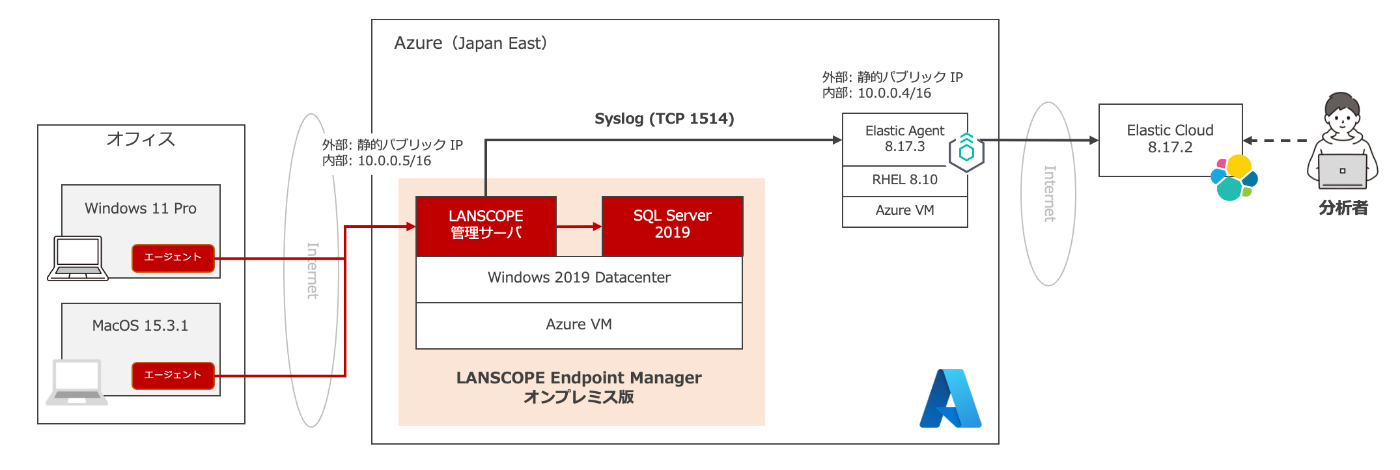
全体構成図
実施内容
以下、実施手順になります。
- Ingest Pipelines の作成
- Integrations のポリシー設定
- Elastic Agent のインストール
- Elastic Cloud でのログ検索
1. Ingest Pipelines の作成
Elastic Agent では、Elasticsearch の Ingest Pipeines [3] を利用する方式が一般的となります。
簡単な処理であれば、Elastic Agent 内の Processor [4] を書くことで処理できます。

Ingest Pipelines
Logstash の場合は、Logstash でログの加工をしましたが、今回は Ingest Pipeines で行います。
基本的にログの加工処理は Logstash の時と同じ処理を実施します。
【処理内容】
| No | Processor Name | 処理内容 |
|---|---|---|
| 01 | Dissect | メッセージのヘッダー部分をバラしてフィールド抽出します |
| 02 | KV | メッセージの本体部分(Key=Value)をバラしてフィールド抽出します |
| 03 | Date | timestamp の時刻を@timestamp に利用します |
| 04 | Convert | 文字列型を数値型の変換します |
| 05 | Remove | 不要なフィールドを削除します |
【補足】
Custom TCP Log integration の Syslog Parsing [5] にメッセージのヘッダー部分のパース処理を任せる予定でしたが、メッセージの本体部分がパースできず log.syslog.structured_data フィールドにログの抽出ができませんでした。

Syslog Parsing で設定した内容
その際に出力されたエラーメッセージの内容は以下のとおりです。
FilePath フィールドの Windows のファイルパスの 2 つ目の \ で失敗しているようでした。(FilePath="C:\\Windows\\System32\\svchost.exe")
Syslog Parsing では処理が難しかったため、結果的に Logstash の時と同様に Dissect Processor に処理を寄せることにしました。
1-1. Ingest Pipelines を開く
Elastic Cloud 管理画面 の Deployment の名前を開き、Kibana にログインします。
ログイン後、[Management] > [Stack Management] > [Ingest Pipelines] を開きます。

Ingest Pipelines を開く
画面右上の [Create piepline] > [New pipeline] を開きます。
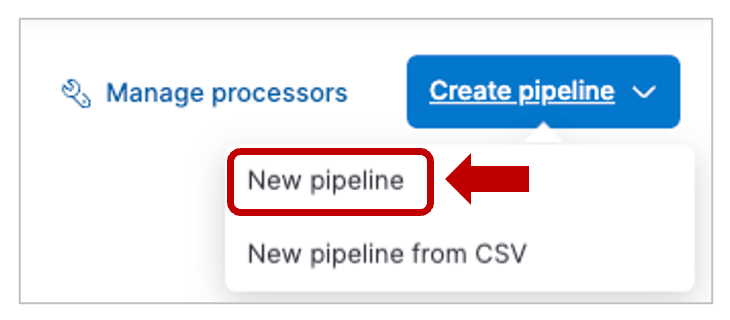
New pipeline
[Name] にパイプライン名(好きな名前で可)を設定します。

Name
1-2. Dissect Processor の作成
画面を少し下に移動し、[Add a processor] を開きます。

Add a Processor
下記内容で Processor を設定し、画面下部の [add processor] で保存します。
❶ Processor で Dissect を指定します。
❷ Field に message と入力します。(ログは message フィールドに入ってきます)
❸ Pattern に <%{pri}>%{version} %{timestamp} %{hostname} %{appname} %{procid} %{msgid} [%{token} %{params}] と記載します。(解説は前回の記事を参照ください)

Dissect Processor の設定
【参考】
・Dissect processor(公式ページ)
1-3. KV Processor の作成
作成した Dissect Processor の下の [Add a processor] をクリックします。
下記内容で Processor を設定し、画面下部の [add processor] で保存します。
❶ Processor で Key-value (KV) を指定します。
❷ Field に params と入力します。(params フィールドを分解します)
❸ Field split に と入力します。(フィールド間は半角スペース区切り)
❹ Value split に = と入力します。(フィールドと値はイコール区切り)
❺ Ignore missing をオンにします。(空値のフィールドを無視します)
❻ Trim value に " と入力します。(値はダブルクォートに括られています)

KV Processor の設定
【参考】
・KV processor(公式ページ)
1-4. Date Processor の作成
作成した KV Processor の下の [Add a processor] をクリックします。
下記内容で Processor を設定し、画面下部の [add processor] で保存します。
❶ Processor で Date を指定します。
❷ Field に timestamp と入力します。(timestamp フィールドの時刻を利用します)
❸ Formats に ISO8601 と入力します。(解説は前回の記事を参照ください)
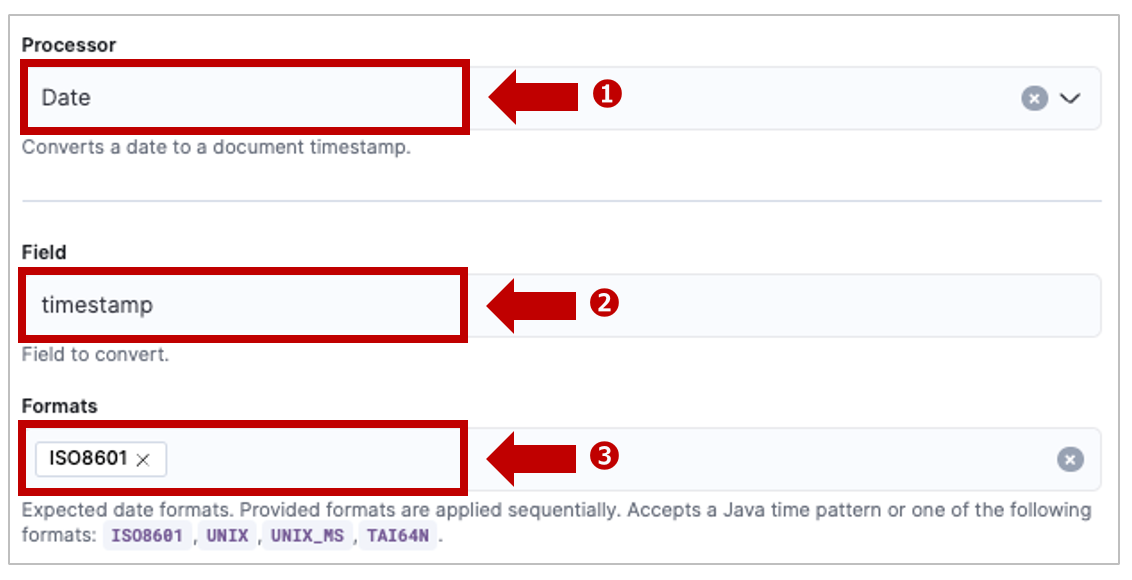
Date Processor の設定
【参考】
・Date processor(公式ページ)
1-5. Convert Processor の作成
作成した Date Processor の下の [Add a processor] をクリックします。
下記内容で Processor を設定し、画面下部の [add processor] で保存します。
❶ Processor で Convert を指定します。
❷ Field に NumOfPrintedPages と入力します。(変換するフィールド名を入力します)
❸ Type に Integer と入力します。(数値型に変換します)

Convert Processor の設定
同じ処理を以下のフィールドでも実施します。
・FileSize
・Score
・NumOfActivationDays
・ActivationTime(sec)
【参考】
・Convert processor(公式ページ)
1-6. Remove Processor の作成
作成した Convert Processor の下の [Add a processor] をクリックします。
下記内容で Processor を設定し、画面下部の [add processor] で保存します。
❶ Processor で Remove を指定します。
❷ Field に削除したいフィールド名を入力します。(解説は前回の記事を参照ください)

Remove Processor の設定
【参考】
・Remove processor(公式ページ)
画面下部の [Create pipeline] をクリックしてパイプラインを作成します。
以上で Ingest Pipelines の作成は完了です。
2. Integrations のポリシー設定
Elastic Agent で有効化する Integrations は elastic-agent.yml で設定します。
Kibana の Integrations 画面で elastic-agent.yml の設定を作成します。
Kibana にログインし、[Integrations] > [Custom] > [Custom TCP Logs] を開きます。

Custom TCP Logs
[Add Custom TCP Logs] をクリックします。

Add Custom TCP Logs
Elastic Agent はあとで手動でインストールするため、ここではスキップします。

skip agent installation
❶ Integration name に好き名前を入力します。(今回は Syslog TCP 1514 RFC5424とします)

Integration settings
Custom TCP Logs の設定を以下のように行います。
❷ Listen Address に 0.0.0.0 と入力します。
❸ Listen port に 1514 と入力します。
❹ Dataset name に tcp.syslog と入力します。(好きな名前でOKです)
❺ Ingest Pipeline に先の手順で作成したパイプライン名を入力します。

Custom TCP Logs の設定
画面下部の [Save and continue] をクリックします。
表示される画面で [Add Elastic Agent to your host] をクリックします。

Add Elastic Agent to your host
今回は Fleet を使わず、スタンドアローンで導入するため、[Run standalone] にチェックを入れます。
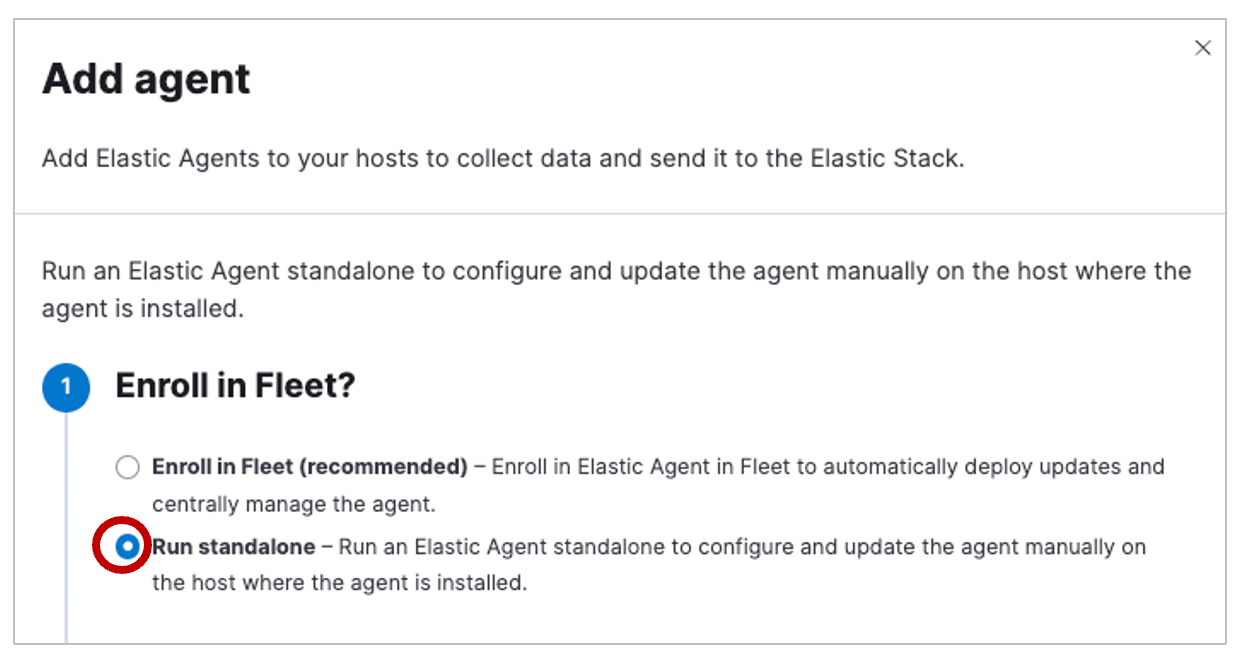
Run standalone
❶ Elastic Agent の設定ファイル(elastic-agent.yml)をダウンロードします。
❷ elastic-agent.yml の api_key で利用する API キーを [Create API Key] で作成します。
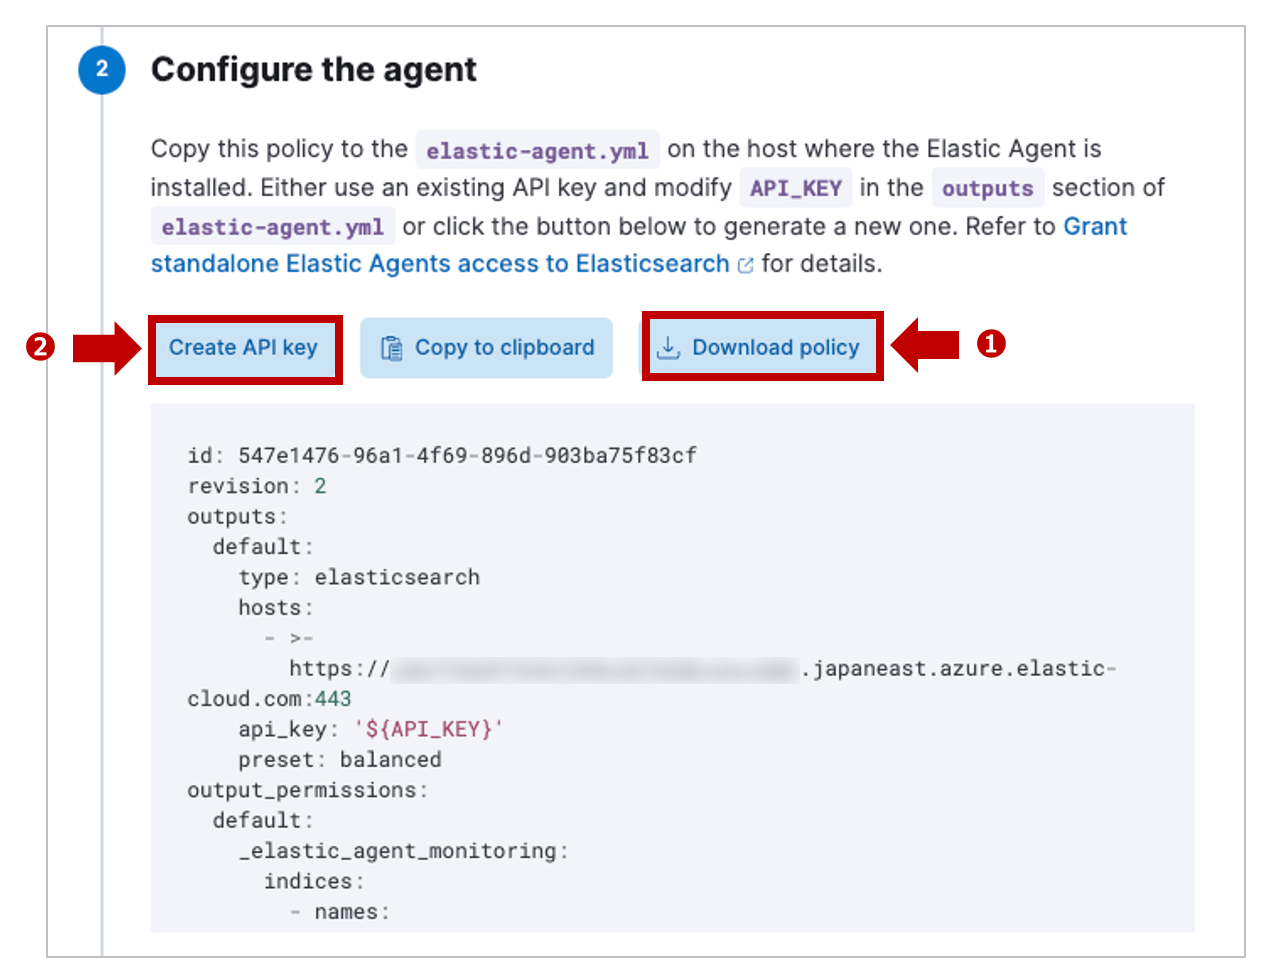
Configure the agent
❸ 生成されたキーをコピーします。(あとで elastic-agent.yml に貼ります)

API Key
3. Elastic Agent のインストール
コマンド操作で RHEL に Elastic Agent をインストールします。
まず、Azure VM のマシンに SSH でログインします。
3-1. Elastic Agent のインストール
ログイン後、curl コマンドを使って、インターネット経由でインストーラーをダウンロードします。
$ sudo curl -L -O https://artifacts.elastic.co/downloads/beats/elastic-agent/elastic-agent-8.17.3-linux-x86_64.tar.gz
ダウンロードしたインストーラー(tar ファイル)を解凍します。
$ sudo tar xzvf elastic-agent-8.17.3-linux-x86_64.tar.gz
インストーラーの実行ファイルが置かれているディレクトリに移動します。
$ sudo cd elastic-agent-8.17.3-linux-x86_64
管理者権限で Elastic Agent のインストールを実行します。
$ sudo ./elastic-agent install
インストールするディレクトリが /opt/Elastic/Agent になるが継続するかと聞かれますが、Y(Yes) とします。
次に Fleet での管理を希望するか聞かれますが、今回は n(no) とします。
Elastic Agent will be installed at /opt/Elastic/Agent and will run as a service. Do you want to continue? [Y/n]:Y
Do you want to enroll this Agent into Fleet? [Y/n]:n

[====] Service Started  [33s] Elastic Agent successfully installed, starting enrollment.
[====] Done  [33s]
Elastic Agent has been successfully installed.
3-2. Elastic Agent の設定
/opt/Elastic/Agent 配下に置かれている elastic-agent.yml を先ほど Kibana からダウンロードしたものに差し替えます。
$ sudo vi /opt/Elastic/Agent/elastic-agent.yml
差し替え後、outputs 句の api_key を先ほどの手順で生成した API キーに書き換えます。
outputs:
  default:
    type: elasticsearch
    hosts:
      - >-
        https://xxxxxxxxxxxxxxxxxxxxxxxxxxxxxxxxxxx.japaneast.azure.elastic-cloud.com:443
    api_key: '<先ほど作成した API キーを貼り付ける>'
    preset: balanced
編集した elastic-agent.yml を :wq! で上書き保存して終了します。
ファイル更新後、Elastic Agent のプロセスを起動します。
$ sudo systemctl start elastic-agent
プロセスが正常起動し、Elasticsearch に Data Streams および Index が作成されれば完了です。
$ sudo systemctl status elastic-agent
4. Elastic Cloud でのログ検索
Kibana の [Management] > [Stack Management] > [Index Management] を開きます。
[Data Streams] タブで logs- tcp.syslog があれば、ログの取り込みは成功です。
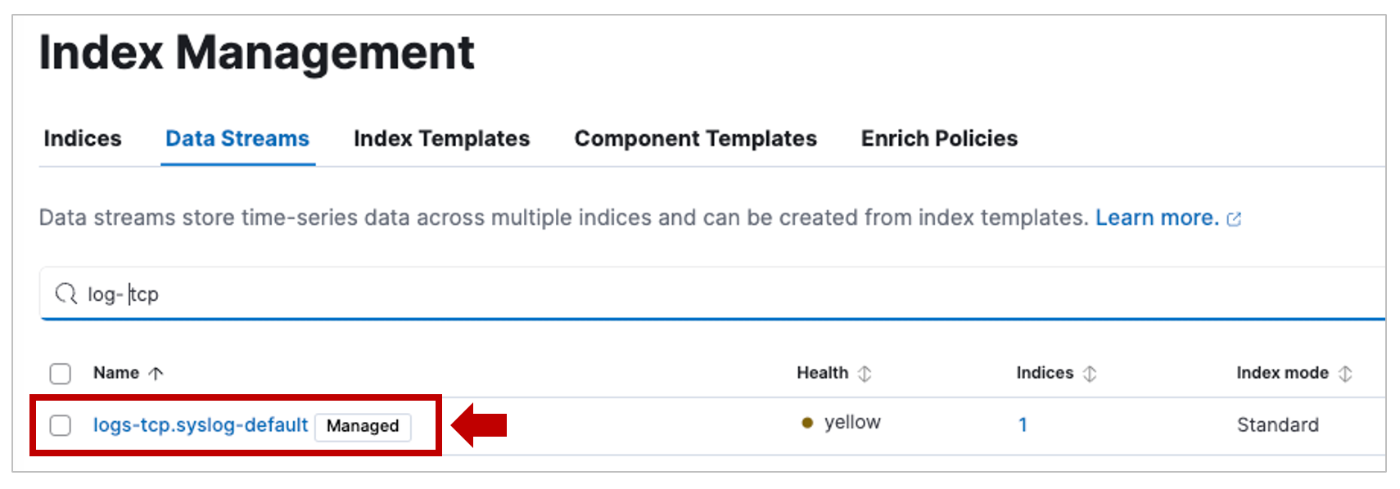
Data Streams
Discover 画面に移動し、[Data view] 右の下矢印から [Create a data view] を開きます。

Crerate a data view
❶ 以下の設定で LANSCOPE 用に Data View を作成します。
・Name は好きな名前をつけます。(Data Streams 名と同じだと分かりやすい)
・Index pattern を logs-tcp.syslog-* とします。
・Timestamp field は @timestamnp を指定します。
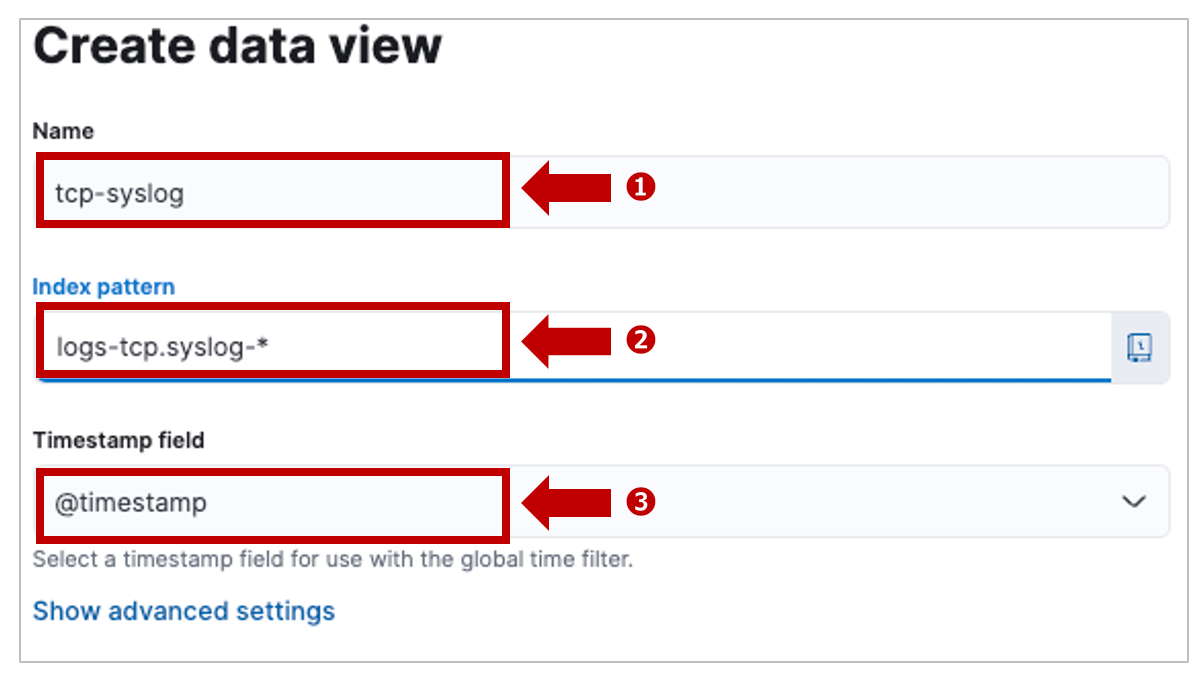
Elastic Agent 用の Data view を作成
画面下部の [Save data view to Kiban] を押して保存します。
❹ Data view で作成した logs-tcp.syslog-* を指定します。
❺ ↔︎ をクリックすると ❻ の取り込んだログの詳細が開きます。

Logstash で取り込んだ時と同じフィールド情報はちゃんと表示できます。
しかし、デフォルトのままでは Elastic Agent 大量のメタフィールドを付与してしまいます。
Elasticsearch のストレージを消費してしまうので、不要な場合は外すことをオススメします。
まとめ
いかがでしたでしょうか?
基本的には Logstash でも Elastic Agent でもどちらでも好みで選択すれば良いと思います。
Elastic Agent や Ingest Pipelines では処理の難しいログ加工処理がある場合や
Ingest Pipelines を使うことで Elasticsearch の処理負荷が無視できないような場合は
Logstash を利用するのが良いでしょう。
{
  "_index": ".ds-logs-tcp.syslog-default-2025.03.20-000001",
  "_id": "WurispUBQfauBiUzHD8x",
  "_version": 1,
  "_source": {
    "agent": {
      "name": "ls-logstash",
      "id": "c68febef-f621-4bc9-addf-d5de9f03d00c",
      "type": "filebeat",
      "ephemeral_id": "707f5377-7722-4f97-aa68-6227b7c9da2b",
      "version": "8.17.3"
    },
    "WindowTitle": "/System/Volumes/Data/Users/hibinohisashi/Desktop/git-repo/xxxxxxxxxxxxx",
    "Category": "12",
    "log": {
      "source": {
        "address": "10.0.0.5:62307"
      }
    },
    "Dept": "test",
    "ActivationTime": "",
    "elastic_agent": {
      "id": "c68febef-f621-4bc9-addf-d5de9f03d00c",
      "version": "8.17.3",
      "snapshot": false
    },
    "Label": "",
    "cloud": {
      "instance": {
        "name": "ls-logstash",
        "id": "3f0ca5ca-a02e-428f-b0f4-b8adc63a1aa6"
      },
      "provider": "azure",
      "machine": {
        "type": "Standard_B2s"
      },
      "service": {
        "name": "Virtual Machines"
      },
      "region": "japaneast",
      "account": {
        "id": "f51cc54a-5156-40c8-bf7f-c1c4ae69df85"
      }
    },
    "AlertType": "",
    "hostname": "ls-mgr2",
    "Off-HourAlert": "深夜",
    "ecs": {
      "version": "8.0.0"
    },
    "appname": "LanScopeCat",
    "Sub-ManagerNo": "51",
    "host": {
      "hostname": "ls-logstash",
      "os": {
        "kernel": "4.18.0-553.el8_10.x86_64",
        "codename": "Ootpa",
        "name": "Red Hat Enterprise Linux",
        "type": "linux",
        "family": "redhat",
        "version": "8.10 (Ootpa)",
        "platform": "rhel"
      },
      "containerized": false,
      "ip": [
        "10.0.0.4",
        "fe80::20d:3aff:fecc:e606"
      ],
      "name": "ls-logstash",
      "id": "1467d0efdb1c466d8e82a48896c77cdb",
      "mac": [
        "00-0D-3A-CC-E6-06"
      ],
      "architecture": "x86_64"
    },
    "LogonUser": "hibino",
    "event": {
      "dataset": "tcp.syslog"
    },
    "timestamp": "2025-03-20T18:24:27.000+09:00",
    "Agent": "MacBook-Pro",
    "UTCDate/Time": "2025-03-20T09:24:27.000+00:00",
    "pri": "116",
    "Device": "",
    "procid": "-",
    "msgid": "Operation",
    "ActivationTime(sec)": "",
    "ServerReceivedDate/Time": "2025-03-20T18:25:34.152+09:00",
    "version": "1",
    "AlertTypeNo": "0",
    "token": "LanScopeCat@49660",
    "input": {
      "type": "tcp"
    },
    "@timestamp": "2025-03-20T09:24:27.000Z",
    "data_stream": {
      "namespace": "default",
      "type": "logs",
      "dataset": "tcp.syslog"
    },
    "Event": "FileDel",
    "IPAddress": "",
    "AgentNo": "1",
    "Application": "ファイル削除",
    "FileSize": ""
  },
  "fields": {
    "elastic_agent.version": [
      "8.17.3"
    ],
    "ActivationTime": [
      ""
    ],
    "host.os.name.text": [
      "Red Hat Enterprise Linux"
    ],
    "Label": [
      ""
    ],
    "host.name.text": [
      "ls-logstash"
    ],
    "host.hostname": [
      "ls-logstash"
    ],
    "host.mac": [
      "00-0D-3A-CC-E6-06"
    ],
    "Off-HourAlert": [
      "深夜"
    ],
    "hostname": [
      "ls-mgr2"
    ],
    "appname": [
      "LanScopeCat"
    ],
    "agent.name.text": [
      "ls-logstash"
    ],
    "host.os.version": [
      "8.10 (Ootpa)"
    ],
    "Sub-ManagerNo": [
      "51"
    ],
    "cloud.service.name.text": [
      "Virtual Machines"
    ],
    "host.os.name": [
      "Red Hat Enterprise Linux"
    ],
    "agent.name": [
      "ls-logstash"
    ],
    "host.name": [
      "ls-logstash"
    ],
    "Agent": [
      "MacBook-Pro"
    ],
    "UTCDate/Time": [
      "2025-03-20T09:24:27.000+00:00"
    ],
    "cloud.region": [
      "japaneast"
    ],
    "host.os.type": [
      "linux"
    ],
    "cloud.instance.name.text": [
      "ls-logstash"
    ],
    "Device": [
      ""
    ],
    "pri": [
      "116"
    ],
    "input.type": [
      "tcp"
    ],
    "ServerReceivedDate/Time": [
      "2025-03-20T18:25:34.152+09:00"
    ],
    "AlertTypeNo": [
      "0"
    ],
    "data_stream.type": [
      "logs"
    ],
    "version": [
      "1"
    ],
    "host.architecture": [
      "x86_64"
    ],
    "cloud.machine.type": [
      "Standard_B2s"
    ],
    "cloud.provider": [
      "azure"
    ],
    "agent.id": [
      "c68febef-f621-4bc9-addf-d5de9f03d00c"
    ],
    "cloud.service.name": [
      "Virtual Machines"
    ],
    "ecs.version": [
      "8.0.0"
    ],
    "host.containerized": [
      false
    ],
    "log.source.address": [
      "10.0.0.5:62307"
    ],
    "agent.version": [
      "8.17.3"
    ],
    "host.os.family": [
      "redhat"
    ],
    "Application": [
      "ファイル削除"
    ],
    "FileSize": [
      ""
    ],
    "WindowTitle": [
      "/System/Volumes/Data/Users/hibinohisashi/Desktop/xxxxxxxxxxxxxxxxxxxxxxxxxxxx"
    ],
    "Category": [
      "12"
    ],
    "Dept": [
      "test"
    ],
    "AlertType": [
      ""
    ],
    "cloud.instance.id": [
      "3f0ca5ca-a02e-428f-b0f4-b8adc63a1aa6"
    ],
    "host.ip": [
      "10.0.0.4",
      "fe80::20d:3aff:fecc:e606"
    ],
    "agent.type": [
      "filebeat"
    ],
    "host.os.kernel": [
      "4.18.0-553.el8_10.x86_64"
    ],
    "LogonUser": [
      "hibino"
    ],
    "elastic_agent.snapshot": [
      false
    ],
    "host.id": [
      "1467d0efdb1c466d8e82a48896c77cdb"
    ],
    "timestamp": [
      "2025-03-20T18:24:27.000+09:00"
    ],
    "elastic_agent.id": [
      "c68febef-f621-4bc9-addf-d5de9f03d00c"
    ],
    "data_stream.namespace": [
      "default"
    ],
    "host.os.codename": [
      "Ootpa"
    ],
    "procid": [
      "-"
    ],
    "ActivationTime(sec)": [
      ""
    ],
    "msgid": [
      "Operation"
    ],
    "token": [
      "LanScopeCat@49660"
    ],
    "@timestamp": [
      "2025-03-20T09:24:27.000Z"
    ],
    "cloud.account.id": [
      "f51cc54a-5156-40c8-bf7f-c1c4ae69df85"
    ],
    "host.os.platform": [
      "rhel"
    ],
    "data_stream.dataset": [
      "tcp.syslog"
    ],
    "Event": [
      "FileDel"
    ],
    "agent.ephemeral_id": [
      "707f5377-7722-4f97-aa68-6227b7c9da2b"
    ],
    "IPAddress": [
      ""
    ],
    "AgentNo": [
      "1"
    ],
    "event.dataset": [
      "tcp.syslog"
    ],
    "cloud.instance.name": [
      "ls-logstash"
    ]
  }
}

Discussion