Ploomberを試す
Ploomberは、データパイプラインを構築する最速の方法です⚡️。お気に入りのエディタ(Jupyter、VSCode、PyCharm)を使ってインタラクティブに開発し、コードを変更せずに☁️にデプロイできます(Kubernetes、Airflow、AWS Batch、SLURM)。レガシーなノートブックがありますか?コマンド1つでモジュール化されたパイプラインにリファクタリングできます。
ドキュメント
なお、クラウド版もある。
クラウド版のドキュメントは以下。
Get Started
Ploomberとは?
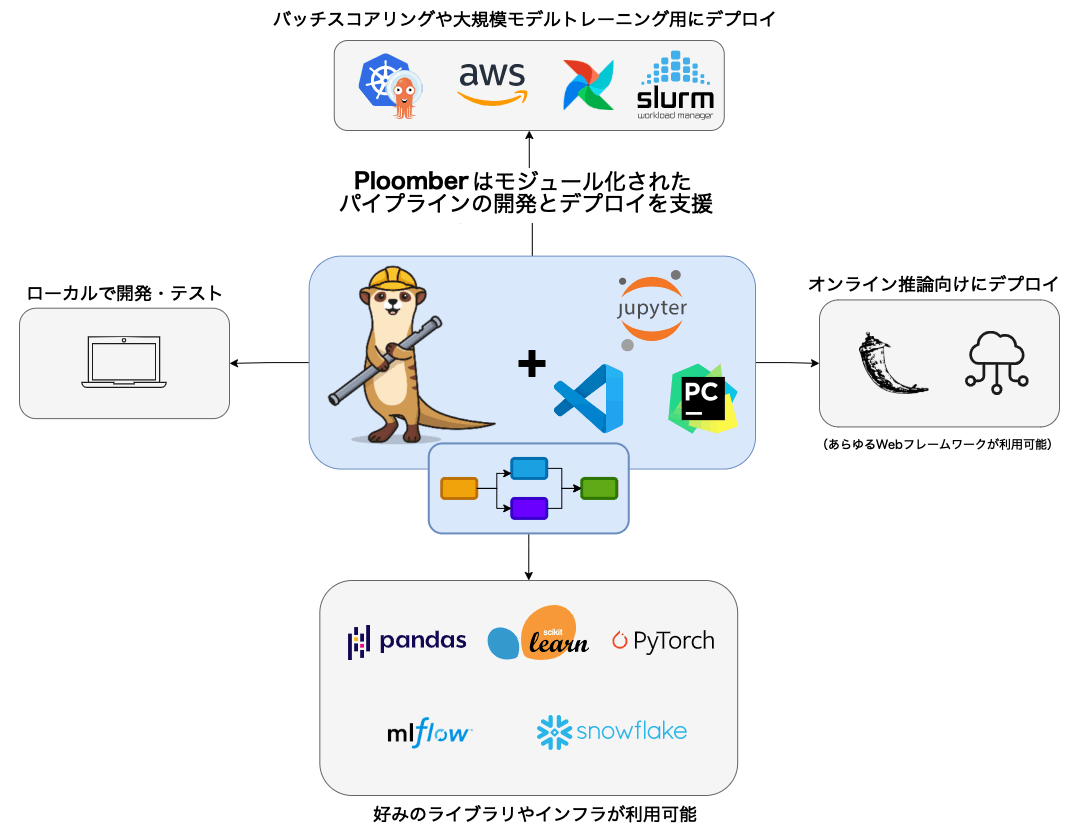
Ploomberは、協調的でモジュール化されたパイプラインを構築するためのフレームワークである。Jupyterと統合されているが、他のエディターでも使用できる。
Ploomberは、ノートブックのリファクタリング問題を解消する。データチームはJupyterノートブックでプロトタイプを作成し、デプロイのためにコードをリファクタリングする。このようなリファクタリングプロセスには高いリスクが伴う。なぜなら、コードを移動する際に分析を壊してしまう可能性が急増してしまい、進捗が遅くなってしまうからだ。
Ploomberを使えば、初日から保守性が高く、共同作業が可能で、本番稼動可能なパイプラインを開発できる。
refered from: https://docs.ploomber.io/en/latest/get-started/what-is.html and translated by kun432
Quickstart
ローカルのJupyterLabでやる
パッケージインストール
!pip install -q ploomber
!pip freeze | grep -i ploomber
ploomber==0.23.2
ploomber-core==0.2.25
ploomber-engine==0.0.32
ploomber-extension==0.1.0
ploomber-scaffold==0.3.1
Your first Python pipeline
サンプルが用意されているようなので、それをダウンロードしてみる。
!ploomber examples -n guides/first-pipeline
Loading examples...
Local copy does not exist...
Cloning into '/home/kun432/.ploomber/projects'...
remote: Enumerating objects: 594, done.
remote: Counting objects: 100% (594/594), done.
remote: Compressing objects: 100% (482/482), done.
remote: Total 594 (delta 98), reused 344 (delta 49), pack-reused 0
Receiving objects: 100% (594/594), 3.47 MiB | 8.61 MiB/s, done.
Resolving deltas: 100% (98/98), done.
======= Copying example guides/first-pipeline to guides/first-pipeline/ ========
Next steps:

$ cd guides/first-pipeline/
$ ploomber install

Open guides/first-pipeline/README.md for details.
Deploy Streamlit apps for free on Ploomber Cloud! Learn more: https://ploomber.io/s/signup
中身はこんな感じ。
$ tree -F guides
guides/
└── first-pipeline/
    ├── 1-get.py
    ├── 2-profile-raw.py
    ├── 3-clean.py
    ├── 4-profile-clean.py
    ├── 5-plot.py
    ├── README.ipynb
    ├── README.md
    ├── _source.md
    ├── environment.yml
    ├── pipeline.html
    ├── pipeline.yaml
    └── requirements.txt
.pyファイルがタスクとなっていて、これらのパイプライン定義がpipeline.yamlになっている。
tasks:
   # sourceが実行したいコード(.ipynbもサポート)
  - source: 1-get.py
    # productがタスクの出力
    product:
      # スクリプトを実行した結果はノートブックとしても出力できる
      nb: output/1-get.html
      # 出力は好きなだけ定義できる
      data: output/raw_data.csv

  - source: 2-profile-raw.py
    product: output/2-profile-raw.html

  - source: 3-clean.py
    product:
      nb: output/3-clean.html
      data: output/clean_data.parquet

  - source: 4-profile-clean.py
    product: output/4-profile-clean.html

  - source: 5-plot.py
    product: output/5-plot.html
ちなみに.pyはこんな感じ。jupytextがあればnotebookとしても開ける。
# %%
"""
Get data
"""
import pandas as pd
from pathlib import Path

# %% tags=["parameters"]
upstream = None
product = None

# %%
df = pd.read_csv("https://raw.githubusercontent.com/nytimes/covid-19-data/master/live/us-counties.csv")
df.head()

# %%
Path('output').mkdir(exist_ok=True)

df.to_csv(str(product['data']), index=False)
# %%
ではパイプラインを実行する。
pipeline.yamlのあるディレクトリに移動。
%cd guides/first-pipeline
依存パッケージをインストール
!pip install -r requirements.txt
パイプライン実行
!ploomber build
Loading pipeline...
Building task '1-get':   0%|                              | 0/5 [00:00<?, ?it/s]
Executing:   0%|                                        | 0/6 [00:00<?, ?cell/s]
Executing:  17%|█████▎                          | 1/6 [00:00<00:04,  1.17cell/s]
Executing: 100%|████████████████████████████████| 6/6 [00:01<00:00,  4.45cell/s]
Building task '2-profile-raw':  20%|██▊           | 1/5 [00:01<00:06,  1.60s/it]
Executing:   0%|                                        | 0/7 [00:00<?, ?cell/s]
Executing:  14%|████▌                           | 1/7 [00:00<00:03,  1.58cell/s]
Executing:  43%|█████████████▋                  | 3/7 [00:01<00:01,  3.30cell/s]
Executing:  71%|██████████████████████▊         | 5/7 [00:01<00:00,  5.12cell/s]
Executing: 100%|████████████████████████████████| 7/7 [00:01<00:00,  4.50cell/s]
Building task '3-clean':  40%|████████            | 2/5 [00:03<00:05,  1.69s/it]
Executing:   0%|                                        | 0/9 [00:00<?, ?cell/s]
Executing:  11%|███▌                            | 1/9 [00:00<00:06,  1.21cell/s]
Executing: 100%|████████████████████████████████| 9/9 [00:01<00:00,  8.50cell/s]
Building task '4-profile-clean':  60%|███████▏    | 3/5 [00:04<00:02,  1.49s/it]
Executing:   0%|                                        | 0/7 [00:00<?, ?cell/s]
Executing:  14%|████▌                           | 1/7 [00:00<00:04,  1.36cell/s]
Executing:  43%|█████████████▋                  | 3/7 [00:01<00:01,  3.03cell/s]
Executing:  71%|██████████████████████▊         | 5/7 [00:01<00:00,  4.78cell/s]
Executing: 100%|████████████████████████████████| 7/7 [00:01<00:00,  4.21cell/s]
Building task '5-plot':  80%|████████████████▊    | 4/5 [00:06<00:01,  1.64s/it]
Executing:   0%|                                        | 0/8 [00:00<?, ?cell/s]
Executing:  12%|████                            | 1/8 [00:00<00:06,  1.00cell/s]
Executing:  62%|████████████████████            | 5/8 [00:01<00:00,  5.02cell/s]
Executing:  88%|████████████████████████████    | 7/8 [00:02<00:00,  2.71cell/s]
Executing: 100%|████████████████████████████████| 8/8 [00:02<00:00,  2.80cell/s]
Building task '5-plot': 100%|█████████████████████| 5/5 [00:09<00:00,  1.95s/it]
name             Ran?      Elapsed (s)    Percentage
---------------  ------  -------------  ------------
1-get            True          1.60299       16.4351
2-profile-raw    True          1.75514       17.9951
3-clean          True          1.24694       12.7846
4-profile-clean  True          1.86731       19.1451
5-plot           True          3.28105       33.64
結果はoutputディレクトリに出力される
!ls output
1-get.html	    3-clean.html	  5-plot.html	      raw_data.csv
2-profile-raw.html  4-profile-clean.html  clean_data.parquet


各スクリプトの中身をざっくり見た感じは、CSVを取ってきてpandasのデータフレームに入れて、ゴニョゴニョしてプロット、ゴニョゴニョしてプロット、ってのを順に繰り返してっていうのを順にやって最終的なプロットを得るという感じっぽい。
パイプラインの一部を更新して再度実行してみる。
from pathlib import Path

path = Path('3-clean.py')
clean = path.read_text()

# 3-clean.pyの最後にprint行を追加する
path.write_text(clean + """
print("hello")
""")
再度パイプライン実行
!ploomber build
Loading pipeline...
Building task '3-clean':   0%|                            | 0/3 [00:00<?, ?it/s]
Executing:   0%|                                        | 0/9 [00:00<?, ?cell/s]
Executing: 100%|████████████████████████████████| 9/9 [00:00<00:00,  9.68cell/s]
Building task '4-profile-clean':  33%|████        | 1/3 [00:01<00:02,  1.19s/it]
Executing:   0%|                                        | 0/7 [00:00<?, ?cell/s]
Executing:  14%|████▌                           | 1/7 [00:00<00:03,  1.59cell/s]
Executing:  43%|█████████████▋                  | 3/7 [00:01<00:01,  3.31cell/s]
Executing:  71%|██████████████████████▊         | 5/7 [00:01<00:00,  5.11cell/s]
Executing: 100%|████████████████████████████████| 7/7 [00:01<00:00,  4.48cell/s]
Building task '5-plot':  67%|██████████████       | 2/3 [00:02<00:01,  1.53s/it]
Executing:   0%|                                        | 0/8 [00:00<?, ?cell/s]
Executing:  12%|████                            | 1/8 [00:00<00:06,  1.02cell/s]
Executing:  62%|████████████████████            | 5/8 [00:01<00:00,  5.75cell/s]
Executing: 100%|████████████████████████████████| 8/8 [00:02<00:00,  3.21cell/s]
Building task '5-plot': 100%|█████████████████████| 3/3 [00:05<00:00,  1.89s/it]
name             Ran?      Elapsed (s)    Percentage
---------------  ------  -------------  ------------
3-clean          True          1.19125       21.0531
4-profile-clean  True          1.76802       31.2465
5-plot           True          2.69903       47.7004
1-get            False         0              0
2-profile-raw    False         0              0
パイプラインで変更された箇所以降だけが実行されているのがわかる。
パイプラインの可視化もできる。
!ploomber plot
ドキュメントではpngが出力されるらしいが、自分で試した際にはpipeline.htmlが出力された。

なお、JupyterLabでHTMLを開くと以下のように表示される場合がある。その場合は上のTrustHTMLをクリックすればOK。

基本コンセプト
3つの規約
- 各タスクは関数、スクリプト、ノートブックである。
- タスクは
upstream変数を使って依存関係を宣言する。 - タスクは
product変数を使って出力を宣言する。
データをプロットするシンプルなパイプラインの例
- Ploomberにおける「パイプライン」は「有向非巡回グラフ(DAG: Directed Acyclic Graph)である。
- 上流タスクからの出力≒"product"が、下流タスクの入力になる。つまり依存関係が発生する。
- サポートしているタスクは以下の3つ
- Python関数 (callable とも呼ばれる)
- Pythonスクリプト/ノートブック(およびRに相当するもの)
- SQLスクリプト
パイプラインの定義
tasks:
  # SQLスクリプトを実行するタスク
  - source: raw.sql
    product: [schema, name, table]
    # ...

  # 関数を実行するタスク
  # "my_functions.clean" は "from my_functions import clean" と同意
  - source: my_functions.clean
    product: output/clean.csv

  # スクリプトを実行するタスク(ノートブックも使える)
  - source: plot.py
    product:
      # スクリプトは常にノートブックを生成する(詳しくは次のセクションで)
      nb: output/plots.ipynb
- パイプラインの定義に必要なもの
-
source: タスクのコードの場所 -
product: タスクの出力の保存場所
-
-
nameでタスク名の定義もできる。- 定義されていない場合はsourceから推測される。
パイプラインの実行
ploomber build
- ploomberはソースの変更を追跡する
-
ploomber buildを複数回実行すると前回実行されたものは実行されない - タスクの変更を行うとそのタスク以降のタスクのみ実行される
-
タスク: スクリプト/ノートブック
-
.py/.ipynbが使える。 - 基本はスクリプト(
.py)を推奨-
.ipynbの場合、コードと出力を含むため、git管理が難しくなる - Jupyterの場合、
.pyをnotebookで開くオプションが使える(jupytextが必要) -
.pyをnotebookで解釈する一つの方法として、# %%を含めるというのがある。-
# %%がノートブックの各セルとして認識される
-
-
- ploomberはスクリプトのコピーを作成して、実行時に
ipynbに変換して実行する - Rで書かれたスクリプト・ノートブックもサポートしている
upstreamとproduct
依存関係を示すために上記のパラメータセルをスクリプト/ノートブックに追加する必要がある
# %% tags=["parameters"]
upstream = ['raw'] # これで raw.pyの実行後にclean.pyが実行されるという意味になる
product = None
- 上記は"2-clean"のタスクの例。
- 1-rawを上流として持つ。
- 1-rawの出力を、入力として受け取る
- これを
upstreamで定義する。 - 依存関係がない場合は
upstream=Noneで定義する。パイプラインの最初のタスクはこれになる。 -
product = Noneはプレースホルダーとして記載。実行時に置き換えられる。
セル挿入プロセス
.pyスクリプトがどのように実行されるかを確認する。rawが上流タスクになっているclean.pyの場合。
import pandas as pd

# %% tags=["parameters"]
upstream = ['raw']
product = None

# %%
df = pd.read_csv(upstream['raw']['data'])
# some data cleaning code...

# %%
# store clean data
df.to_csv(str(product['data']), index=False)
パイプライン実行時にPloomberはpipeline.yamlを参照して、上流からのupstream変数と下流へのproduct変数を抽出して、スクリプト/ノートブックに挿入する。こういう感じ。
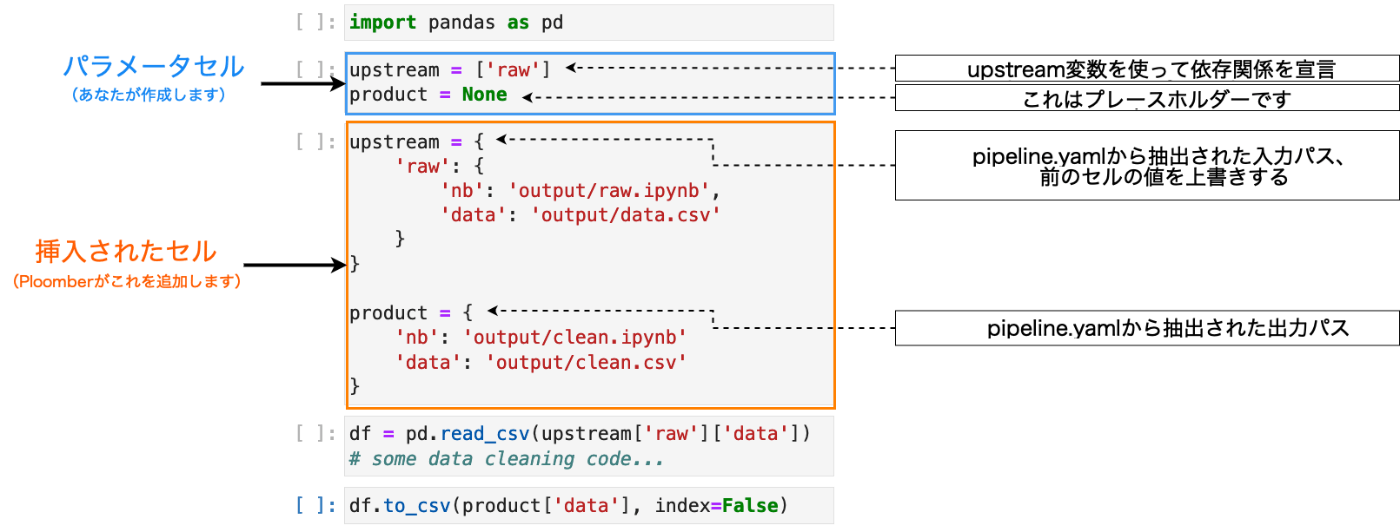
refered from https://docs.ploomber.io/en/latest/get-started/what-is.html and translated by kun432
このときpipeline.yamlは以下のようになっている。
task:
    - source: raw.py
      product:
        nb: 'output/raw.ipynb'
        data: output/data.csv
    - source: clean.py
      product:
        nb: 'output/clean.ipynb'
        data: output/clean.csv
ここで入出力の場所が定義されるので、スクリプトはそれを元に処理を行うということになる。
なお、スクリプトは常に実行されたノートブックを出力する。
tasks:
  - source: plot.py
    # ノートブックを出力
    product: output/plots.ipynb
複数の(フォーマット等で)出力を行う場合は以下のように辞書で定義する。
tasks:
  - source: plot.py
    product:
      # スクリプトが他の出力を生成する場合、ノートブックは"nb"で指定する
      nb: output/plots.ipynb
      # 他のファイルには他のキーで指定する
      data: output/data.csv
手動でセルを挿入する場合は以下
ploomber nb --inject
pipeline.yamlで同じsourceが指定されている場合、--injectは一番最初に宣言されたタスクのパラメータを注入する。以下の例だと task-aのパラメータが挿入される。
tasks:
- source: template.ipynb
   name: task-a
   product: output/template-task-a.ipynb
   params:
   some_param: param-a

- source: template.ipynb
   name: task-a-suffix
   product: output/template-task-a-suffix.ipynb
   params:
   some_param: param-a-suffix

- source: template.ipynb
   name: task-b-suffix
   product: output/template-task-b-suffix.ipynb
   params:
   some_param: param-b-suffix
ここのロジックは設定で変更できる。setup.cfgで設定する。
これはデフォルトと同じだけど、明示的にtask-aのパラメータが挿入されるのだと思う。
[ploomber]
entry-point = path/to/pipeline.yaml
inject-priority = task-a
以下のようにワイルドカードを使うと、task-a-suffixに param-a-suffix、task-b-suffixに param-b-suffixが挿入されるらしい。
[ploomber]
entry-point = path/to/pipeline.yaml
inject-priority = *-suffix
また、以下のようにpipeline.yamlにプレースホルダーを使うことができる。この場合、プレースホルダーに埋め込まれる変数はenv.yamlで指定する。
tasks:
- source: print.py
   name: print
   product:
      nb: 'output/{{some_param}}/notebook.html'
   papermill_params:
      log_output: True
   params:
      some_param: '{{some_param}}'
ちょっとこのあたりの動きは実際に動かしてみないとわからないな。
タスク: 関数
タスクとして関数を使う場合は、productパラメータを持つ必要があるだけ。
import pandas as pd

def clean(product):
   # product引数を使って出力を保存
   df.to_csv(product)
上流タスクからの入力を使うにはupstremパラメータを以下のように追加する。
import pandas as pd

def clean(product, upstream):
   df_input = pd.read_csv(upstream['タスク名'])
   df.to_csv(product)
これにより、ploomberが依存関係を解決する際にupstream['タスク名']が参照している内容を取得して、以下のような形でアクセスできるようになる。
upstream={'タスク名': 'path/to/product/from/upstream.csv'}
productが複数の出力を生成する場合、これらは辞書としてアクセスできる。例えば、以下のようなパイプラインの場合。
task:
    - source: raw.py
      product:
        nb: 'output/raw.ipynb'
        data: output/data.csv
    - source: clean.py
      product:
        nb: 'output/clean.ipynb'
        data: output/clean.csv
clean.pyでraw.pyのproductにアクセスするには
upstream['raw']['data']
となるし、raw.pyでも
df.to_csv(product['data'])
というような指定になるのだろうと思う。
タスク: SQL
SQLを実行するタスクの場合。当然SQLの実行にはDBアクセスできる環境や設定が必要になるが、そこは以下のドキュメントを参照。
ここではSQLタスクにおけるproductとupstreamについてのみ扱う。
どちらもSQLスクリプト内にプレースホルダーで指定する。
依存関係がない場合
CREATE TABLE {{product}} AS
SELECT * FROM my_table WHERE my_column > 10
このときpipeline.yamlは以下のようになる。
tasks:
    source: create-table.sql
    product: [schema, name, table]
これを実行すると以下のように置き換わる。
CREATE TABLE schema.name AS
SELECT * FROM my_table WHERE my_column > 10
なお、productは以下のようなパターンがあるらしい。
[schema, name, table][name, table]-
[schema, name, view]: viewを使う場合
依存関係がある場合は以下のような形でupstreamを定義できる。
CREATE TABLE {{product}} AS
SELECT * FROM {{upstream['task_name']}} WHERE my_column > 10
RDBはあんまり詳しくないので参考程度に。。。。
Intro to Ploomber
Intro to ...とタイトルにはあるけれども、なんとなくテクニック的な使い方のような気がする。。。。とりあえずやってみる。
まずサンプルをダウンロード。このサンプルはCOVID-19の予測を立てるようなものらしい。
!ploomber examples -n guides/intro-to-ploomber
ディレクトリに移動
%cd guides/intro-to-ploomber
で紹介されているのは以下のようなテクニック。
- 100個のノートブックを並列実行する
- ワークフローをパラメータ化する
- HTML/PDFでレポート生成する
1つ前まではコマンドラインでの実行だったが、どうやらPythonでも書ける様子。 ただドキュメントにはあまり記載がないようで、以下のサンプルを使うのが良さそうな雰囲気。
とりあえずはドキュメント通りに進める。
まず依存パッケージをインストール
!pip install -r requirements.txt
並列実行
from ploomber import DAG
from ploomber.tasks import ShellScript, PythonCallable
from ploomber.products import File
from ploomber.executors import Parallel

from ploomber.spec import DAGSpec

spec = DAGSpec('./pipeline.yaml')
dag = spec.to_dag()
# dag.executor = Parallel()
build = dag.build(force=True)  # force=Trueでキャッシュしない
Building task 'load':   0%|                                                                                                                           | 0/7 [00:00<?, ?it/s]
Executing:   0%|                                                                                                                                    | 0/6 [00:00<?, ?cell/s]
Executing: 100%|████████████████████████████████████████████████████████████████████████████████████████████████████████████████████████████| 6/6 [00:01<00:00,  5.79cell/s]
Building task 'clean':  14%|████████████████▎                                                                                                 | 1/7 [00:01<00:06,  1.05s/it]
Executing:   0%|                                                                                                                                    | 0/7 [00:00<?, ?cell/s]
Executing: 100%|████████████████████████████████████████████████████████████████████████████████████████████████████████████████████████████| 7/7 [00:00<00:00,  9.23cell/s]
Building task 'split':  29%|████████████████████████████████▌                                                                                 | 2/7 [00:02<00:05,  1.00s/it]
Executing:   0%|                                                                                                                                    | 0/7 [00:00<?, ?cell/s]
Executing:  14%|█████████████████▋                                                                                                          | 1/7 [00:00<00:05,  1.09cell/s]
Executing: 100%|████████████████████████████████████████████████████████████████████████████████████████████████████████████████████████████| 7/7 [00:01<00:00,  5.46cell/s]
Building task 'linear-regression':  43%|███████████████████████████████████████████▋                                                          | 3/7 [00:03<00:04,  1.14s/it]
Executing:   0%|                                                                                                                                    | 0/7 [00:00<?, ?cell/s]
Executing: 100%|████████████████████████████████████████████████████████████████████████████████████████████████████████████████████████████| 7/7 [00:01<00:00,  4.45cell/s]
Building task 'polynomial-regression':  57%|████████████████████████████████████████████████████████                                          | 4/7 [00:04<00:03,  1.32s/it]
Executing:   0%|                                                                                                                                    | 0/7 [00:00<?, ?cell/s]
Executing: 100%|████████████████████████████████████████████████████████████████████████████████████████████████████████████████████████████| 7/7 [00:01<00:00,  5.28cell/s]
Building task 'random-forest':  71%|███████████████████████████████████████████████████████████████████████████▋                              | 5/7 [00:06<00:02,  1.33s/it]
Executing:   0%|                                                                                                                                    | 0/7 [00:00<?, ?cell/s]
Executing:  14%|█████████████████▋                                                                                                          | 1/7 [00:01<00:06,  1.03s/cell]
Executing: 100%|████████████████████████████████████████████████████████████████████████████████████████████████████████████████████████████| 7/7 [00:01<00:00,  5.14cell/s]
Building task 'lasso-regression':  86%|████████████████████████████████████████████████████████████████████████████████████████▎              | 6/7 [00:07<00:01,  1.35s/it]
Executing:   0%|                                                                                                                                    | 0/8 [00:00<?, ?cell/s]
Executing: 100%|████████████████████████████████████████████████████████████████████████████████████████████████████████████████████████████| 8/8 [00:01<00:00,  5.81cell/s]
Building task 'lasso-regression': 100%|███████████████████████████████████████████████████████████████████████████████████████████████████████| 7/7 [00:09<00:00,  1.29s/it]
んー、並列実行しているようには見えない。
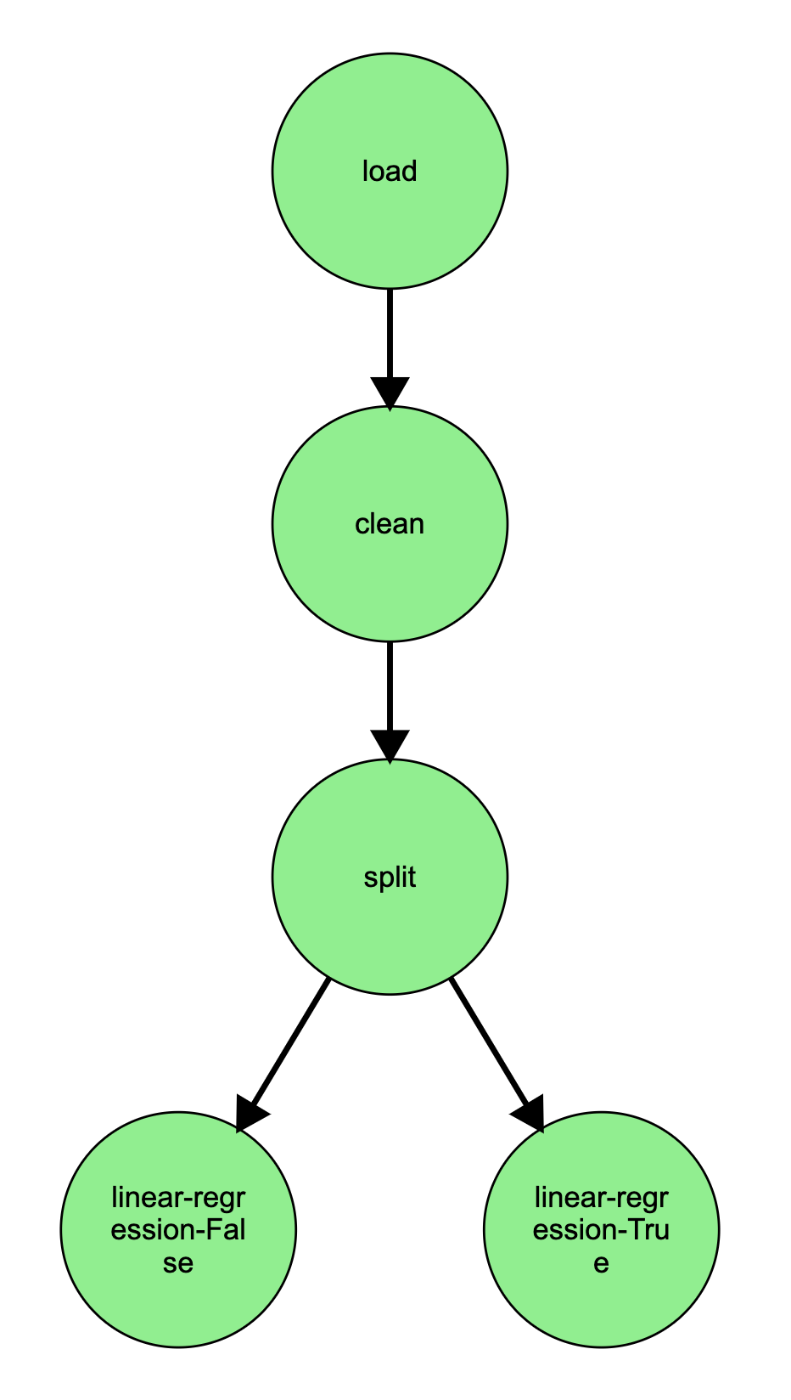
とりあえず可視化
dag.plot()
デフォルトだとセル内にembedされるのだけども、自分の環境ではちょっとうまくいかなくて、以下のようにファイル出力した。
dag.plot(output="pipeline.html")

で、並列実行のところ。以下のコメントアウトのところの有無で比べてみた。
%%time

dag = spec.to_dag()
#dag.executor = Parallel()
build = dag.build(force=True)
CPU times: user 811 ms, sys: 68.2 ms, total: 880 ms
Wall time: 9.37 s
%%time

dag = spec.to_dag()
dag.executor = Parallel()
build = dag.build(force=True)
CPU times: user 6.31 s, sys: 107 ms, total: 6.41 s
Wall time: 6.69 s
なるほど、こちらは並列実行できている。
pipeline.yamlはこんな感じ。
# executor: parallel
# executor:
#   dotted_path: ploomber.executors.Parallel
#   processes: 2 # limit to a max of 2 processes

tasks:

- source: tasks/load.py
  product:
    data: output/load-data.pkl
    nb: output/load.ipynb
  papermill_params:
    allow_nested_loop: True

- source: tasks/clean.py
  product:
    data: output/clean-data.pkl
    nb: output/clean.html
  papermill_params:
    allow_nested_loop: True

- source: tasks/split.py
  product:
    X_test: output/split-X_test.pkl
    y_test: output/split-y_test.pkl
    y_train: output/split-y_train.pkl
    y: output/split-y.pkl
    X: output/split-X.pkl
    X_train: output/split-X_train.pkl
    nb: output/split.ipynb
  papermill_params:
    allow_nested_loop: True

- source: tasks/linear-regression.py
  product:
    nb: output/linear-regression.ipynb
  papermill_params:
    allow_nested_loop: True
  nbconvert_export_kwargs:
    # optionally hide the code from the report
    exclude_input: True

- source: tasks/polynomial-regression.py
  product:
    nb: output/polynomial-regression.ipynb
  papermill_params:
    allow_nested_loop: True

- source: tasks/random-forest.py
  product:
    nb: output/random-forest.ipynb
  papermill_params:
    allow_nested_loop: True

- source: tasks/lasso-regression.py
  product:
    nb: output/lasso-regression.ipynb
  papermill_params:
    allow_nested_loop: True
なるほど、最初のパラメータとかallow_nested_loopとかあたりが必要になるっぽい。
ワークフローのパラメータ化
実行時にパラメータやデータを変えたい場合がある。線形回帰を別パラメータで実行する例。
from ploomber.spec import DAGSpec

spec = DAGSpec('./pipeline-params.yaml')
dag = spec.to_dag()
build = dag.build(force=True)
build
dag.plot(output="parameterize.html")
pipeline.yamlはこんな感じ。
tasks:

- source: tasks/load.py
  product:
    data: output/load-params-data.pkl
    nb: output/load-params.ipynb

- source: tasks/clean.py
  product:
    data: output/clean-params-data.pkl
    nb: output/clean-params.ipynb

- source: tasks/split.py
  product:
    X_test: output/split-params-X_test.pkl
    y_test: output/split-params-y_test.pkl
    y_train: output/split-params-y_train.pkl
    y: output/split-params-y.pkl
    X: output/split-params-X.pkl
    X_train: output/split-params-X_train.pkl
    nb: output/split-params.ipynb

- source: tasks/linear-regression.py
  name: linear-regression-[[fit_intercept]]
  product:
    nb: output/linear-regression-[[fit_intercept]].ipynb

  grid:
    # generates 2 tasks
    - fit_intercept: [True, False]
最後のところがそれっぽい。
自動レポート
ワークフローの一部をレポートとして生成することができる。
# 特定のHTMLレポート/データがあれば、それぞれを開く
from IPython.display import IFrame, display
from pathlib import Path

report = "./output/linear-regression.html"
if Path(report).is_file():
    display(IFrame(src=report, width='100%', height='500px'))
else:
    print("レポートは存在しません - ノートブックを順番に実行して下さい")
レポートは存在しません - ノートブックを順番に実行して下さい
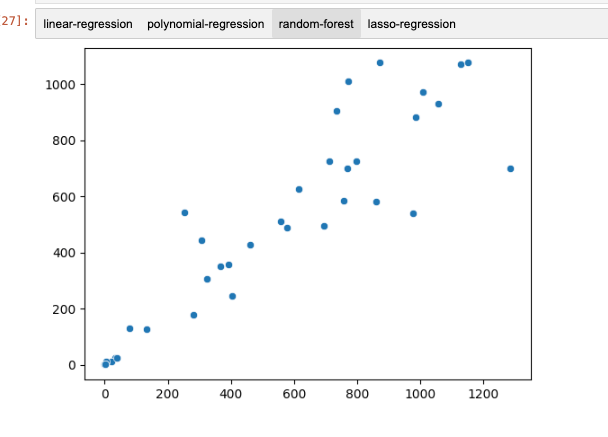
from sklearn_evaluation import NotebookCollection
# 実験別のID
ids = [
'linear-regression', 'polynomial-regression', 'random-forest', 'lasso-regression'
]
# ファイル出力
files = [f'output/{i}.ipynb' for i in ids]
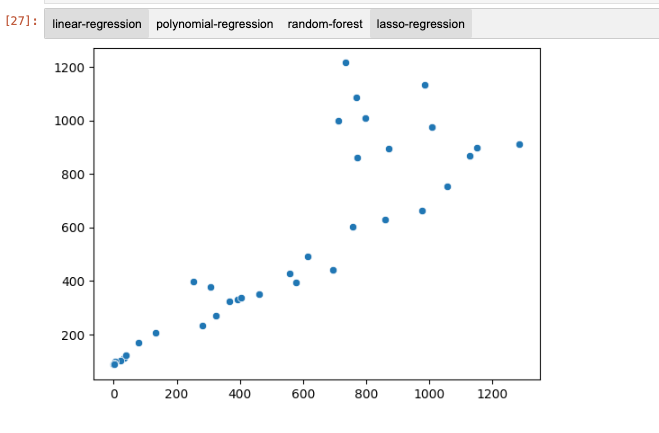
nbs = NotebookCollection(paths=files, ids=ids)
list(nbs)
nbs['plot']


ワークフローエンジン、だいたいちょっと重厚というか、インフラも必要になる感じのものが多い印象なのだけど、PloomberはJupyterとうまく組みあわせることでこの辺をクリアしているのかなーと思う。とても軽量に使えるように感じるし、それほど難しい気もしないので使っていけばすぐに慣れそう。
ただここまでやる中でドキュメントはあまり親切な感じはしないかな。いっそ、サンプルのノートブックを色々試すほうが速そうな印象。
ユースケースがあれば使ってみたい。