Rechartsで睡眠グラフを作成する
はじめに
この記事では、チャートライブラリの Recharts を使って睡眠グラフを作成していきます。
公式の Examples は豊富にあるのですが、欲しかったものが無かったので紹介します。
作成するグラフ
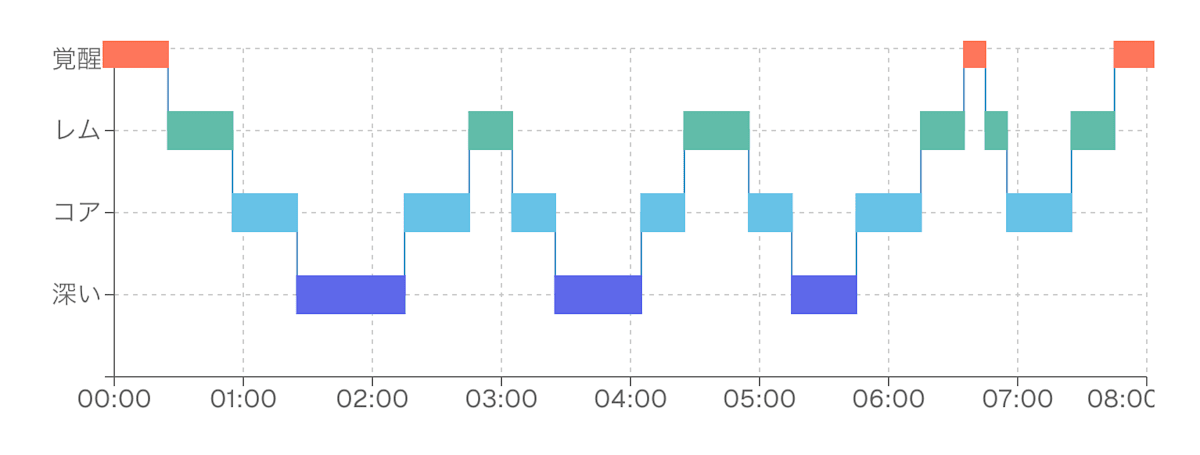
今回は以下のようなグラフを作成していきます。

左から「ヘルスケア」、「MOTHER」、「Oura Ring」
睡眠の状態を4つに分けて表現します。
- 覚醒
- レム睡眠
- コア睡眠
- 深い睡眠
最終的に完成するもの

最終的なコード
import { CartesianGrid, Line, LineChart, Tooltip, XAxis, YAxis } from 'recharts';

export const SleepChart = () => {
  /**
   * 睡眠データ
   * time: 時間
   * status: 睡眠状態(1: 深い睡眠, 2: ノンレム睡眠, 3: 浅い睡眠, 4: 覚醒)
   */
  const data = [
    // 1回目のサイクル
    { time: '00:00', status: 4 },
    { time: '00:10', status: 4 },
    { time: '00:20', status: 4 },
    { time: '00:30', status: 3 },
    { time: '00:40', status: 3 },
    { time: '00:50', status: 3 },
    { time: '01:00', status: 2 },
    { time: '01:10', status: 2 },
    { time: '01:20', status: 2 },
    { time: '01:30', status: 1 },

    // 2回目のサイクル
    { time: '01:40', status: 1 },
    { time: '01:50', status: 1 },
    { time: '02:00', status: 1 },
    { time: '02:10', status: 1 },
    { time: '02:20', status: 2 },
    { time: '02:30', status: 2 },
    { time: '02:40', status: 2 },
    { time: '02:50', status: 3 },
    { time: '03:00', status: 3 },
    { time: '03:10', status: 2 },

    // 3回目のサイクル
    { time: '03:20', status: 2 },
    { time: '03:30', status: 1 },
    { time: '03:40', status: 1 },
    { time: '03:50', status: 1 },
    { time: '04:00', status: 1 },
    { time: '04:10', status: 2 },
    { time: '04:20', status: 2 },
    { time: '04:30', status: 3 },
    { time: '04:40', status: 3 },
    { time: '04:50', status: 3 },

    // 4回目のサイクル
    { time: '05:00', status: 2 },
    { time: '05:10', status: 2 },
    { time: '05:20', status: 1 },
    { time: '05:30', status: 1 },
    { time: '05:40', status: 1 },
    { time: '05:50', status: 2 },
    { time: '06:00', status: 2 },
    { time: '06:10', status: 2 },
    { time: '06:20', status: 3 },
    { time: '06:30', status: 3 },

    // 5回目のサイクル
    { time: '06:40', status: 4 },
    { time: '06:50', status: 3 },
    { time: '07:00', status: 2 },
    { time: '07:10', status: 2 },
    { time: '07:20', status: 2 },
    { time: '07:30', status: 3 },
    { time: '07:40', status: 3 },
    { time: '07:50', status: 4 },
    { time: '08:00', status: 4 },
  ];

  return (
    <LineChart
      width={730}
      height={250}
      data={data}
      margin={{ top: 5, right: 30 }}
    >
      <CartesianGrid strokeDasharray="3 3" />
      <XAxis
        dataKey="time"
        ticks={['00:00', '01:00', '02:00', '03:00', '04:00', '05:00', '06:00', '07:00', '08:00']}
      />
      <YAxis
        tickFormatter={(value) => {
          switch (value) {
            case 1:
              return '深い';
            case 2:
              return 'コア';
            case 3:
              return 'レム';
            case 4:
              return '覚醒';
            default:
              return '';
          }
        }}
      />
      <Tooltip
        formatter={(value) => {
          const name = '状態';
          switch (value) {
            case 1:
              return ['深い', name];
            case 2:
              return ['コア睡眠', name];
            case 3:
              return ['レム睡眠', name];
            case 4:
              return ['覚醒', name];
            default:
              return '';
          }
        }}
      />
      <Line
        type="step"
        dataKey="status"
        dot={false}
        activeDot={false}
        label={(props) => {
          return (
            <CustomizedLabel
              dataLength={data.length}
              {...props}
            />
          );
        }}
      />
    </LineChart>
  );
};

/**
 * index: インデックス
 * dataLength: 睡眠レコードの数
 * value: 睡眠ステータス(1~4)
 * x: x座標
 * y: y座標
 */
interface CustomizedLabelProps {
  dataLength: number;
  index: number;
  value: number | string;
  x: number;
  y: number;
}

const CustomizedLabel = ({ dataLength, index, value, x, y }: CustomizedLabelProps) => {
  const width = 15;
  const height = 25;

  const adjustXForFirstAndLast = (index: number, dataLength: number) => {
    if (index === 0) return x;
    if (index === dataLength - 1) return x - width;
    return x - width / 2;
  };

  let fill = '';
  switch (value) {
    case 1:
      fill = '#5E68EA';
      break;
    case 2:
      fill = '#67C2E7';
      break;
    case 3:
      fill = '#61BCA9';
      break;
    case 4:
      fill = '#FE765B';
      break;
  }

  return (
    <rect
      x={adjustXForFirstAndLast(index, dataLength)}
      y={y - height / 2}
      width={width}
      height={height}
      fill={fill}
    />
  );
};
STEP0. サンプルデータ
前提としてRechartsで扱うデータは、オブジェクトを持つ配列である必要があります。
[{ name: 'a', value: 12 }]
[{ name: 'a', value: [5, 12] }]
本来であれば睡眠データは1分ごとで持っていることが多いと思うのですが、全部用意するのは大変なので今回は10分ごとのデータを用意しました。
プロパティは時間と睡眠状態です。
// time: 時間
// status: 睡眠状態(1: 深い睡眠, 2: コア睡眠, 3: レム睡眠, 4: 覚醒)

const data = [
  { time: "00:00", status: 4 }, // 覚醒
  { time: "00:10", status: 4 }, // 覚醒
  { time: "00:20", status: 4 }, // 覚醒
  { time: "00:30", status: 3 }, // レム睡眠
  // ...続く
]
00:00~08:00までのデータ
// よく見かける睡眠周期にしています。

/**
 * 睡眠データ
 * time: 時間
 * status: 睡眠状態(1: 深い睡眠, 2: コア睡眠, 3: レム睡眠, 4: 覚醒)
 */
const data = [
  // 1回目のサイクル
  { time: "00:00", status: 4 },
  { time: "00:10", status: 4 },
  { time: "00:20", status: 4 },
  { time: "00:30", status: 3 },
  { time: "00:40", status: 3 },
  { time: "00:50", status: 3 },
  { time: "01:00", status: 2 },
  { time: "01:10", status: 2 },
  { time: "01:20", status: 2 },
  { time: "01:30", status: 1 },

  // 2回目のサイクル
  { time: "01:40", status: 1 },
  { time: "01:50", status: 1 },
  { time: "02:00", status: 1 },
  { time: "02:10", status: 1 },
  { time: "02:20", status: 2 },
  { time: "02:30", status: 2 },
  { time: "02:40", status: 2 },
  { time: "02:50", status: 3 },
  { time: "03:00", status: 3 },
  { time: "03:10", status: 2 },

  // 3回目のサイクル
  { time: "03:20", status: 2 },
  { time: "03:30", status: 1 },
  { time: "03:40", status: 1 },
  { time: "03:50", status: 1 },
  { time: "04:00", status: 1 },
  { time: "04:10", status: 2 },
  { time: "04:20", status: 2 },
  { time: "04:30", status: 3 },
  { time: "04:40", status: 3 },
  { time: "04:50", status: 3 },

  // 4回目のサイクル
  { time: "05:00", status: 2 },
  { time: "05:10", status: 2 },
  { time: "05:20", status: 1 },
  { time: "05:30", status: 1 },
  { time: "05:40", status: 1 },
  { time: "05:50", status: 2 },
  { time: "06:00", status: 2 },
  { time: "06:10", status: 2 },
  { time: "06:20", status: 3 },
  { time: "06:30", status: 3 },

  // 5回目のサイクル
  { time: "06:40", status: 4 },
  { time: "06:50", status: 3 },
  { time: "07:00", status: 2 },
  { time: "07:10", status: 2 },
  { time: "07:20", status: 2 },
  { time: "07:30", status: 3 },
  { time: "07:40", status: 3 },
  { time: "07:50", status: 4 },
  { time: "08:00", status: 4 },
];
STEP1. チャートはLineChartを使う
ベースとして使うのはLineChartです。
ドキュメントで紹介されている書き方から不要な部分を削除して表示すると次のようになります。

サンプルコード
import { CartesianGrid, Line, LineChart, Tooltip, XAxis, YAxis } from "recharts";

export const SleepChart = () => {
  return (
    <LineChart
      width={730}
      height={250}
      data={data}
    >
      <CartesianGrid strokeDasharray="3 3" />
      <XAxis dataKey="time" />
      <YAxis />
      <Tooltip />
      <Line
        type="monotone"
        dataKey="status"
      />
    </LineChart>
  )
}
これを睡眠グラフっぽくするには、<Line>コンポーネントのtypeをstepにします。
  <Line
-   type="monotone"
+   type="step"
    dataKey="status"
  />
 線の引かれ方が変化する
STEP2. Y軸を整える
軸の目盛りのフォーマットを自由に行えるtickFormatterを使います。
睡眠状態と文言が合うように書きます。
<YAxis
  tickFormatter={(value) => {
    switch (value) {
      case 1:
        return '深い';
      case 2:
        return 'コア';
      case 3:
        return 'レム';
      case 4:
        return '覚醒';
      default:
        return '';
    }
  }}
/>
 Y軸の目盛りが変化する
STEP3. X軸を整える
表示されている時間がバラバラで見にくいので1時間ごとに表示させてみます。
軸の目盛りの値を設定できるticksを使います。
<XAxis
  dataKey="time"
  ticks={['00:00', '01:00', '02:00', '03:00', '04:00', '05:00', '06:00', '07:00', '08:00']}
/>
 X軸の目盛りが変化する
STEP4. ツールチップを整える
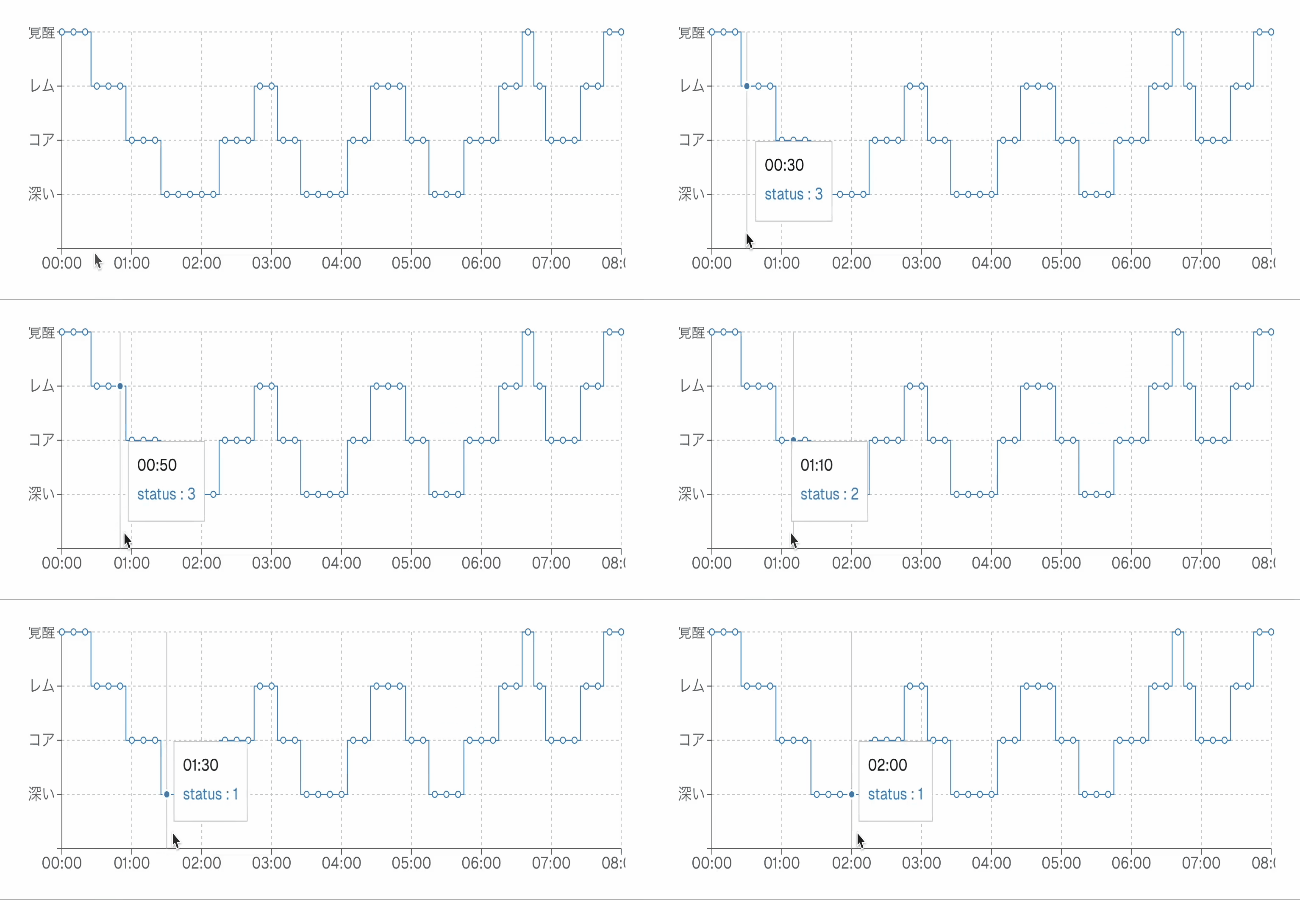
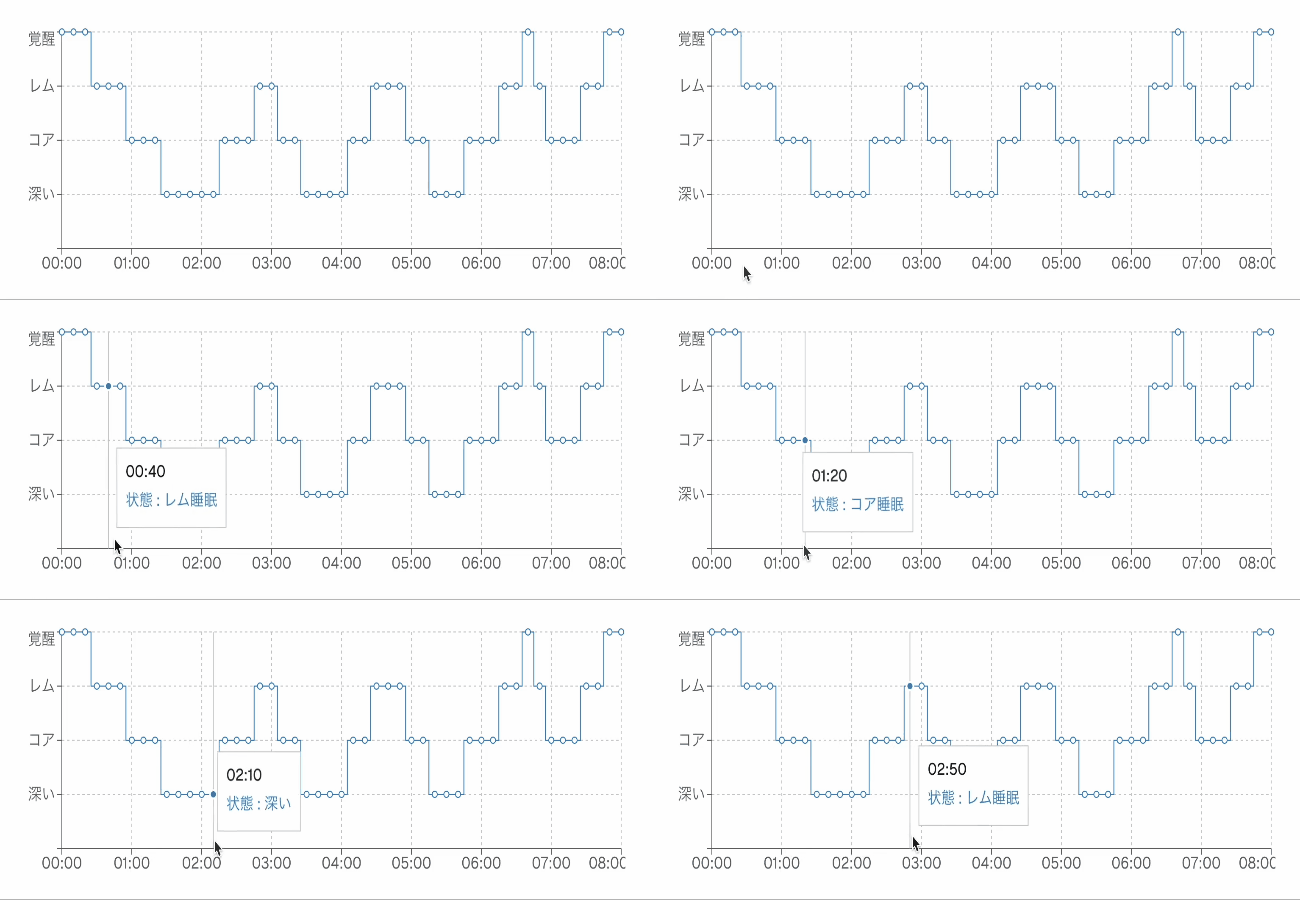
デフォルトではデータがそのまま表示されるので、睡眠状態が分かるように変更します。
 変更前
変更前
表示される値をフォーマットできるformatterを使います。
<Tooltip
  formatter={(value) => {
    const name = '状態';
    switch (value) {
      case 1:
        return ['深い', name];
      case 2:
        return ['コア睡眠', name];
      case 3:
        return ['レム睡眠', name];
      case 4:
        return ['覚醒', name];
      default:
        return '';
    }
  }}
/>
 変更後
変更後
STEP5. 睡眠グラフっぽくする
いよいよ睡眠グラフっぽくしていきます。
ドットを消す
まず、ドットは不要なので非表示にします。
  <Line
    type="step"
    dataKey="status"
+   dot={false}
+   activeDot={false}
  />
 ドットを非表示にした
labelを設定する(中身をみる)
次に、labelを設定していきます。
ここが今回のメインになると思います。
labelには、Boolean | Object | ReactElement | Functionを渡すことができます。
ここで睡眠グラフっぽくなるようにカスタマイズを行います。
<Line dataKey="value" label />
<Line dataKey="value" label={{ fill: 'red', fontSize: 20 }} />
<Line dataKey="value" label={<CustomizedLabel />} />
<Line dataKey="value" label={renderLabel} />
labelの型は(property) label?: ImplicitLabelType | undefinedとなっており、
型を辿っていくと以下のように定義されていました。
interface LabelProps {
    viewBox?: ViewBox;
    parentViewBox?: ViewBox;
    formatter?: Function;
    value?: number | string;
    offset?: number;
    position?: LabelPosition;
    children?: ReactNode;
    className?: string;
    content?: ContentType;
    textBreakAll?: boolean;
    angle?: number;
    index?: number;
}
export type Props = Omit<SVGProps<SVGTextElement>, 'viewBox'> & LabelProps;
export type ImplicitLabelType = boolean | string | number | ReactElement<SVGElement> | ((props: any) => ReactElement<SVGElement>) | Props;
propsがanyになっているので、実際に何が入っているか確認します。
<Line
  type="step"
  dataKey="status"
  dot={false}
  activeDot={false}
  label={(props) => {
    console.log('props: ', props); // console.log()してみる
    return;
  }}
/>

/**
 * ログ出力結果
 * props: {
 *  content: (props)=> {…}
 *  index: 47
 *  offset: 5
 *  parentViewBox: undefined
 *  textBreakAll: undefined
 *  value: 4
 *  viewBox: {x: 711.25, y: 5, width: 0, height: 0}
 *  x: 711.25
 *  y: 5
 * }
 *
*/
今回は以下のプロパティが使えそうでした。
| プロパティ | 値 |
|---|---|
| index | dataのindex |
| value | 睡眠状態(1~4) |
| x | x座標 |
| y | y座標 |
labelを設定する(実装する)
では、どのように実装するかというと<rect>を使ってラベルを作ります。
例えば、以下のように正方形を書いてみます。
<Line
  type="step"
  dataKey="status"
  // dot={false}  //座標が分かりやすいように一旦ドットを表示させます
  activeDot={false}
  label={(props) => (
    <rect
      x={props.x}
      y={props.y}
      width={10}
      height={10}
    />
  )}
/>
すると、propsで渡ってきたxとyの座標を原点として正方形が表示されます。
これを応用してラベルを作っていきます。
 rectを表示
色を調整する
まずは分かりやすいように睡眠状態によってラベルの色を変えます。
<Line
  type="step"
  dataKey="status"
  // dot={false}
  activeDot={false}
  label={(props) => {
    let fill = '';
    switch (props.value) {
      case 1:
        fill = '#5E68EA';
        break;
      case 2:
        fill = '#67C2E7';
        break;
      case 3:
        fill = '#61BCA9';
        break;
      case 4:
        fill = '#FE765B';
        break;
    }
    return (
      <rect
        x={props.x}
        y={props.y}
        width={10}
        height={10}
        fill={fill}
      />
    );
  }}
/>
 色を変化させた
座標と大きさを調整する
今はラベルとラベルの間に隙間があるので、この隙間が埋まるくらいにwidthを調整します。
heightもいい感じの大きさに調整します。
また、表示位置を中央に合わせるためにxとyからそれぞれwidthとheightの半分の大きさを引いておきましょう。
<Line
  type="step"
  dataKey="status"
  dot={false}
  activeDot={false}
  label={(props) => {
    let fill = '';
    switch (props.value) {
      case 1:
        fill = '#5E68EA';
        break;
      case 2:
        fill = '#67C2E7';
        break;
      case 3:
        fill = '#61BCA9';
        break;
      case 4:
        fill = '#FE765B';
        break;
    }

    return (
      <rect
        x={props.x - 7.5}
        y={props.y - 12.5}
        width={15}
        height={25}
        fill={fill}
      />
    );
  }}
/>
 一気にそれっぽくなった
最終調整
最初と最後の覚醒ラベルが枠からはみ出ているので調整します。
また、コード量が多くなってきたのでlabelは別コンポーネントに切り出します。
// 〜〜〜
<Line
  type="step"
  dataKey="status"
  dot={false}
  activeDot={false}
  label={(props) => {
    return (
      <CustomizedLabel
        dataLength={data.length}
        {...props}
      />
    );
  }}
/>
// 〜〜〜

interface CustomizedLabelProps {
  dataLength: number;
  index: number;
  value: number | string;
  x: number;
  y: number;
}

const CustomizedLabel = ({ dataLength, index, value, x, y }: CustomizedLabelProps) => {
  const width = 15;
  const height = 25;

  const adjustXForFirstAndLast = (index: number, dataLength: number) => {
    if (index === 0) return x;
    if (index === dataLength - 1) return x - width;
    return x - width / 2;
  };

  let fill = '';
  switch (value) {
    case 1:
      fill = '#5E68EA';
      break;
    case 2:
      fill = '#67C2E7';
      break;
    case 3:
      fill = '#61BCA9';
      break;
    case 4:
      fill = '#FE765B';
      break;
  }

  return (
    <rect
      x={adjustXForFirstAndLast(index, dataLength)}
      y={y - height / 2}
      width={width}
      height={height}
      fill={fill}
    />
  );
};
 はみ出しを調整
おわりに
表現の仕方によっては今回紹介した以外の作り方もあると思うので、違うパターンで作ったときはぜひ教えていただきたいです!
Discussion
素晴らしいチュートリアルでした!睡眠グラフのカスタマイズ方法がとても分かりやすかったです。実際に試してみます!
ありがとうございます!