"回帰"とは何か? Why is the term "regression" used?
The English translation follows the Japanese text.
統計学や機械学習に関わる人たちが普段何気なく使っている"回帰"という言葉について考えてみる。回帰という言葉を辞書で調べてみると以下のようになっている。
[名](スル)ひとまわりして、もとの所に帰ること。「伝統への―」
一方で統計学や機械学習の分野の人達が"回帰"と言ったときには以下のような意味で使っている。
結果となる数値と要因となる数値の関係を調べて、それぞれの関係を明らかにする統計的手法。
これらの用法の繋がりは全く自明ではない。ここではなぜ統計学や機械学習の分野で"回帰"という言葉が使われるようになったかについて考えてみたい。
まず、図1のようなデータが与えられたとする。このとき、このデータに2変量正規分布と回帰直線を当てはめることを考える。

図1
当てはめた結果、図2が得られた。ただし、2変量正規分布は最尤推定法によって当てはめ、回帰直線は最小二乗法によって当てはめた。
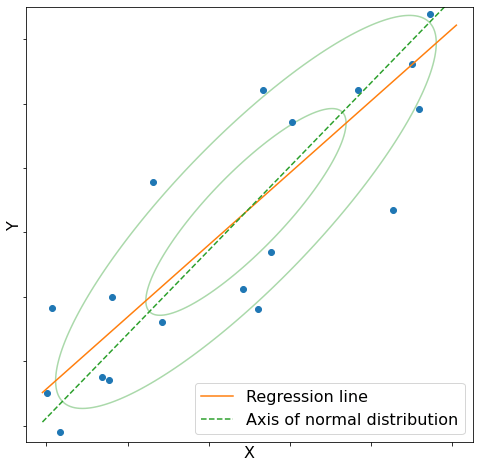
図2
この図から以下のことが分かる。
- 回帰直線と正規分布の軸は異なる。
- 正規分布の軸に比べ、回帰直線の傾きは緩やかである。
- (図には示していないが1.と2.から
y x x y
実際には回帰直線は2変量正規分布の条件付き期待値
ここで
すなわち、父親の身長が平均よりも大きいとき息子の身長は父親の身長よりも小さくなる傾向があり、逆に父親の身長が平均よりも小さいとき息子の身長は父親の身長よりも大きくなる傾向がある。すなわち第2世代は平均の方向に"回帰"するのである。これが統計学における"回帰"の謂れである。
参考文献: 統計ライブラリー 回帰分析 (佐和 隆光)
Let's consider the word "regression", which is usually used casually by people involved in statistics and machine learning. A dictionary search of the word "regression" reveals the following.
the act of going back to a previous place or state; return or reversion.
On the other hand, when people in the fields of statistics and machine learning use the term "regression", they mean the following.
the analysis or measure of the association between one variable (the dependent variable) and one or more other variables (the independent variables)
The connection between these usages is not at all obvious. Here we will consider why the term "regression" came into use in the fields of statistics and machine learning.
First, suppose that the data shown in Figure 1 are given. We then consider fitting a bivariate normal distribution and a regression line to this data.
Figure 1
As a result of the fitting, Figure 2 was obtained. Note that the bivariate normal distribution was fitted by the maximum likelihood estimation method and the regression line was fitted by the least squares method.
Figure 2
From this figure it can be seen that.
- the axis of the normal distribution and the regression line are different.
- the slope of the regression line is slower than the axis of the normal distribution.
- (Although not shown in the figure, from 1. and 2. we can also see that the results of the regression of
y x x y
Actually, the regression line corresponds to the conditional expectation of the bivariate normal distribution
Let
That is, when the father's height is greater than the average, the son's height tends to be smaller than the father's height, and conversely, when the father's height is smaller than the average, the son's height tends to be greater than the father's height. In other words, the second generation "regresses" in the direction of the mean. This is the origin of "regression" in statistics.
References: 統計ライブラリー 回帰分析 (佐和 隆光)
Discussion