📈
【LaTeX】CSVから折れ線グラフを書く


今回取り扱う作品
ソースコード
-
main.tex\documentclass{standalone} \usepackage{pgfplots} \usepackage{filecontents} \begin{filecontents}{data.csv} a,b,c 1,3,6 2,4,5 3,3,7 4,1,2 5,1,1 \end{filecontents} \begin{filecontents}{data2.csv} 1,3,6 2,4,5 3,3,7 4,1,2 5,1,1 \end{filecontents} \pgfplotsset{compat=1.18} \begin{document} \begin{tikzpicture} \begin{axis} [ xlabel={\(n\)}, ylabel={\(t\)}, % 最小を(0,0) enlarge x limits=false, width=10cm, height=10cm, % y軸tick 間隔 ytick distance=0.5, % y軸最小値 ymin=0, % x軸最小値 xmin=0, % 凡例の位置 legend=inner, legend pos=north west, % y軸tick 大きさ yticklabel style={font=\small} ] % グラフ描画 \addplot[black, thick, dotted, mark=*, mark options={fill=red,solid}] table [x=a, y=b, col sep=comma, mark options={solid}] {data.csv}; \addlegendentry{Label1}% 凡例登録 % 数式グラフ描画 \addplot[domain=1:3,thin,mark=none,samples={300}] plot(\x, {\x^2}); \addlegendentry{\(t=n^2\)} % Indexがない場合のCSV 0列目からn列目でx,y軸を設定する \addplot[black, thick, dashed, mark=square*, mark options={solid}] table [x index=0, y index=2, col sep=comma] {data2.csv}; \addlegendentry{Label2} \end{axis} \end{tikzpicture} \end{document}
出力
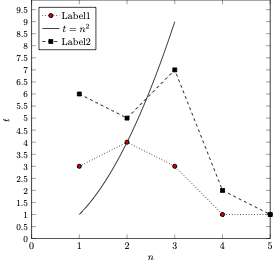 図1
図1
その他
+ \addplot[black, thick, dotted, mark=*, mark options={fill=red,solid}] table [x=a, y=b, col sep=comma] {data.csv};
- \addplot[black, thick, dotted, mark=*, mark options={fill=red}] table [x=a, y=b, col sep=comma] {data.csv};
Discussion