OpenTelemetry Collector の Span Metrics Connector を使ってメトリクスを生成してみる
はじめに
こんにちは、逆井(さかさい)です。
この記事は OpenTelemetry Advent Calendar 2023 21 日目の記事です。
空きがあったので入れちゃいました。タイトルの通り、Span Metrics Connector を最小構成で紹介するだけの内容なのでサッと読めます!
Span Metrics Connector とは
Connectors
Span Metrics Connector の紹介に入る前に、OpenTelemetry Collector の Connectors(以下、コネクター)というコンポーネントについて簡単に紹介します。コネクターはエクスポーターとレシーバーの両方の役割を持ち、2 つのテレメトリーパイプラインを繋ぐ働きをします。
どういうことかイメージをつけるために、OpenTelemetry Collector の以下の Configuration を例に Count Connector というコネクターについて見ていきます。これは、OpenTelemetry の Connectors のドキュメントから拝借しています。
receivers:
  foo:

exporters:
  bar:

connectors:
  count:
    spanevents:
      my.prod.event.count:
        description: The number of span events from my prod environment.
        conditions:
          - 'attributes["env"] == "prod"'
          - 'name == "prodevent"'

service:
  pipelines:
    traces:
      receivers: [foo]
      exporters: [count]
    metrics:
      receivers: [count]
      exporters: [bar]
上の設定例では、Count Connector を用いて、トレースパイプラインとメトリクスパイプラインを接続し、条件(スパンの attribute やスパン名)に合致したスパン数をカウントし、メトリクス(my.prod.event.count)として出力するようにしています。このようにコネクターを使ってテレメトリーの加工、処理を便利に行うテレメトリーパイプラインを構成することができます。
この Count Connector の例では、スパンの数を見ていますが、特定のログの数をカウントしてメトリクス生成することもできます。これについては @katzchang さんの記事が分かりやすく解説してくれていますので興味のある方は見てみください。
コネクターには他にもいろいろ種類があり(Contrib Repository)、今回紹介する Span Metrics Connector もその一つです。
Span Metrics Connector
トレースパイプラインとメトリクスパイプラインを接続し、「取得したスパンから Request, Error and Duration (R.E.D) メトリクスを生成してくれるコネクター」です。元々 Span Metrics Processor として提供されていましたがコネクターが導入されこちらは今は deprecated となっています。Processor よりだいぶ Configuration の記述が簡易的になっています。
このコネクターを使うことで、トレース計装をしていれば、そこから取得したトレース、スパン情報を使ってアプリケーションのメトリクスを収集することができて便利です。
Span Metrics Connector を使ってみる
では早速、やっていきましょう。
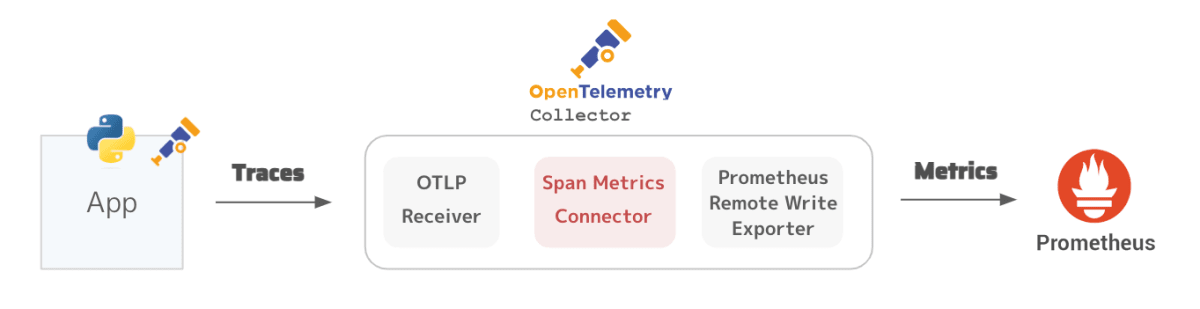
今回は、アプリケーションから分散トレースを OpenTelemetry Collector に送信し、Span Metrics Connector で処理し、Prometheus にメトリクスを Prometheus Remote Write Exporter を使って送信していく構成にします。
OpenTelemetry Collector と Prometheus
まずは、OpenTelemetry Collector の Configuration です。コネクターを使って、トレースとメトリクスのパイプラインを繋いでいきます。
# レシーバーは OTLP/gRPC で分散トレースを受信
receivers:
  otlp:
    protocols:
      grpc:

# エクスポーターは Prometheus Remote Writer でメトリクスを送信
exporters:
  prometheusremotewrite:
    endpoint: http://prometheus:9090/api/v1/write
    target_info:
      enabled: true

# コネクターの設定。追加で設定可能な値は GitHub を確認してみてください
# https://github.com/open-telemetry/opentelemetry-collector-contrib/tree/main/connector/spanmetricsconnector
connectors:
  spanmetrics:
    histogram:
      explicit:
        buckets: [1ms, 10ms, 100ms, 200ms, 300ms, 400ms, 500ms, 600ms, 700ms, 800ms, 900ms, 1s]
    metrics_flush_interval: 3s

service:
  pipelines:
    traces:
      receivers: [otlp]
      exporters: [spanmetrics]
    metrics:
      receivers: [spanmetrics]
      exporters: [prometheusremotewrite]
この Configuration を使って OpenTelemetry Collecotr と Prometheus を起動します。
また、Prometheus には Remote Write でメトリクスを送信するため、--enable-feature=remote-write-receiver オプションを指定してあげます。
compose.yml
services:

  # OTel Collector
  otel-collector:
    image: otel/opentelemetry-collector-contrib:0.91.0
    restart: always
    command: ["--config=/etc/otel-collector-config.yaml"]
    volumes:
      - ./otel-collector-config.yaml:/etc/otel-collector-config.yaml
    ports:
      - "4317:4317"   # OTLP gRPC receiver

  # Prometheus
  prometheus:
    image: prom/prometheus:v2.48.1
    restart: always
    volumes:
      - ./prometheus.yaml:/etc/prometheus/prometheus.yml
    ports:
      - "9090:9090"
    command:
      - '--config.file=/etc/prometheus/prometheus.yml'
      - '--web.enable-remote-write-receiver'
これで OpenTelemetry Collector と Prometheus は起動します。
❯ docker ps
CONTAINER ID   IMAGE                                         COMMAND                   CREATED          STATUS          PORTS                                                        NAMES
b5f1410a6ad1   prom/prometheus:v2.48.1                       "/bin/prometheus --c…"   13 minutes ago   Up 13 minutes   0.0.0.0:9090->9090/tcp, :::9090->9090/tcp                    advent-calender-sre-2023-prometheus-1
d53d9df4dcd9   otel/opentelemetry-collector-contrib:0.91.0   "/otelcol-contrib --…"   13 minutes ago   Up 13 minutes   0.0.0.0:4317->4317/tcp, :::4317->4317/tcp, 55678-55679/tcp   advent-calender-sre-2023-otel-collector-1
Python アプリを自動計装して起動
アプリケーションからトレースを送信します。Python では自動計装ツールがあるので、それを使ってアプリケーションを実行します。
# 自動計装ツールのインストール
pip install opentelemetry-distro==0.41b0
opentelemetry-bootstrap -a install
pip install opentelemetry-sdk==v1.20.0 opentelemetry-exporter-otlp==v1.20.0

# OpenTelemetry 設定
export OTEL_SERVICE_NAME=SRE_ADVENT_CALENDAR_APP
export OTEL_TRACES_EXPORTER=otlp
export OTEL_EXPORTER_OTLP_PROTOCOL=grpc
export OTEL_EXPORTER_OTLP_ENDPOINT=http://localhost:4317

# 自動計装ツールを用いてアプリケーションの実行
opentelemetry-instrument python app.py
これで、アプリケーションからトレース情報が OpenTelemetry Collector に送られて便利です。自動計装についてもう少し詳しく知りたい方は Cloud Native Days 2023 で発表したので見てみてください。(宣伝)
準備 OK!テレメトリーを見てみましょう
OpenTelemetry Collector でトレース情報を取得し、メトリクスを Prometheus に送信できていれば、Prometheus では以下のメトリクスを取得できているはずです。
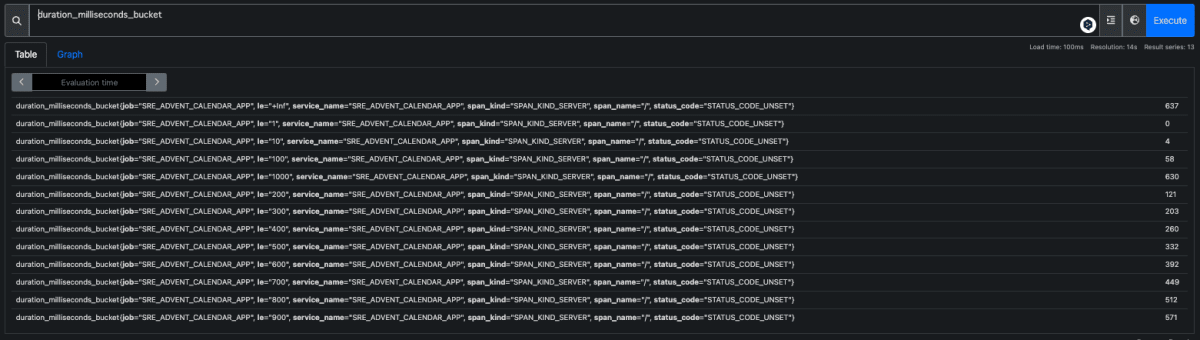
duration_milliseconds_sumduration_milliseconds_countduration_milliseconds_bucket
これらが Span Metrics Connector により生成されたメトリクスです。累積ヒストグラム値である duration_milliseconds_bucket はコネクターの設定(otel-collector-config.yaml)で指定した buckets を元に以下のように取得できていることが Prometheus で確認できます。
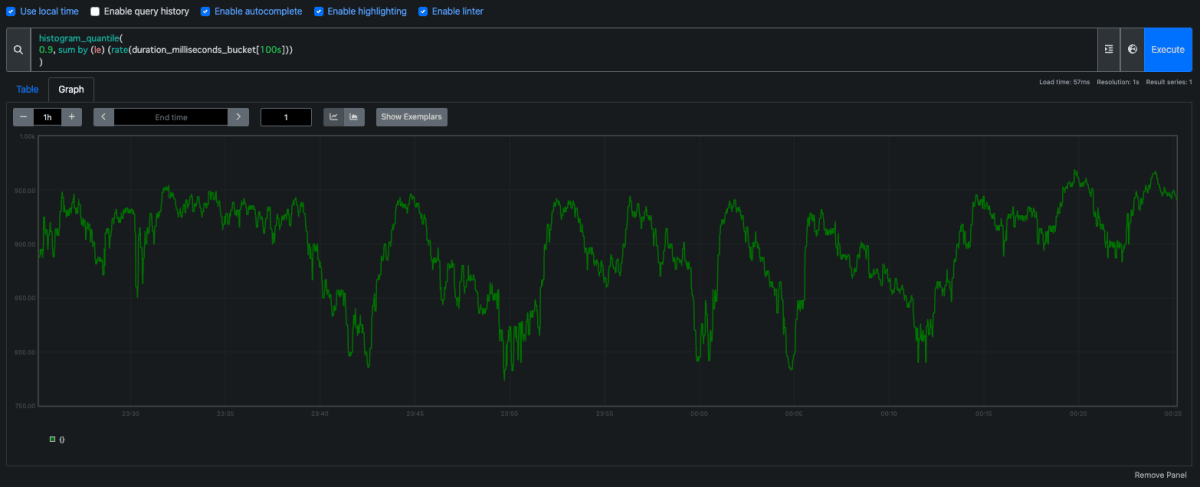
このメトリクスを使い、90 %ile 応答時間を計算すると以下のようなグラフを作ることができます。アプリケーションでは Flask サーバーがリクエストを受信しハンドラーを実行した際のスパンを取得しているため、このグラフを見ることでアプリケーションがどんな時間で応答できているかを監視することができます。
ユーザー影響のあるスパンの時間などをモニタリングしたいときなどに活用できそうです。
このように、分散トレースのみ取得しているアプリケーションからも、OpenTelemetry Collector のテレメトリー処理(今回は Span Metrics Connector を活用)に乗っかることで、メトリクスを収集できるという一例を見てみました。便利なので、OpenTelemetry Collector を使うモチベが高まります。
最後に
OpenTelemetry Collector のコネクターと、その一つである Span Metrics Connector をサクッと紹介しました。明日は @AoToLog_ の 「OpenTelemetry と〇〇」です。〇〇 に何が入るかは 当日のお楽しみということで楽しみです!
Discussion