OpenTelemetry CollectorでTail-based samplingする
実装例だけ知りたいという方は以下をご覧ください。
OpenTelemetry Collectorとは?
公式ドキュメントには以下のように記載されています。
The OpenTelemetry Collector offers a vendor-agnostic implementation of how to receive, process and export telemetry data. It removes the need to run, operate, and maintain multiple agents/collectors. This works with improved scalability and supports open source observability data formats (e.g. Jaeger, Prometheus, Fluent Bit, etc.) sending to one or more open source or commercial back-ends. The local Collector agent is the default location to which instrumentation libraries export their telemetry data.
[和訳] OpenTelemetry Collectorは、テレメトリデータの受信、処理、およびエクスポート方法について、ベンダーに依存しない実装を提供します。これにより、複数のエージェント/コレクターを実行、運用、および維持する必要がなくなります。これにより、改善されたスケーラビリティが実現され、オープンソースの観測可能性データ形式(例:Jaeger、Prometheus、Fluent Bitなど)をサポートし、1つ以上のオープンソースまたは商用のバックエンドに送信できます。ローカルコレクターエージェントは、計装ライブラリがテレメトリデータをエクスポートするデフォルトの場所です。
OpenTelemetry Colleoctorを使わない場合、OpenTelemetryで取得したテレメトリーデータをどのバックエンドにエクスポートするかをアプリに実装する必要があります。例えばローカルで動作させる時はJaeger、本番環境で動作させる時はNewRelicにエクスポートしたいといった場合は環境に応じてエクスポート先を変更するよう実装しなければなりません。
OpenTelemetry Colleoctorを使うと、OpenTelemetry Colleoctorがバックエンドへのエクスポートを担当してくれるので、アプリはOpenTelemetry Colleoctorにトレースを流すだけでよくなります。
また、規模の大きな本番環境でOpenTelemetryを使う時はサンプリングが必須になると思いますが、サンプリングもOpenTelemetry Colleoctor側でできるようになります。
Tail-based samplingとは?
サンプリングには以下2種類があります。
- Head-based sampling
- Tail-based sampling
Head-based samplingはシンプルでパフォーマンス影響が少ない一方、ランダムなサンプリングになるため見たいトレースがサンプリングされない可能性があります。
Tail-based samplingはサンプリング条件を細かく設定できるため見たいトレースを確実にバックエンドにエクスポートできます。
以下の記事に詳しく書かれているので気になる方は一読されることをおすすめします。
Tail-based samplingするためにはOpenTelemetry Collectorを利用する必要があります。
実装
ローカルで動きを見ていきたいのでJaegerにエクスポートしていきます。言語はGoで実装しています。
docker-compose.yml
version: "3"

services:
  otel-collector:
    image: ghcr.io/open-telemetry/opentelemetry-collector-releases/opentelemetry-collector-contrib:0.83.0-amd64
    command:
      - "--config"
      - /etc/otel/config.yml
    ports:
      - 4317:4317
    volumes:
      - ./config.yml:/etc/otel/config.yml
  jaeger:
    image: jaegertracing/all-in-one:1.48
    expose:
      - 14250
    ports:
      - 16686:16686
docker-composeを使ってOpenTelemetry CollectorとJaegerを動作させています。本番環境ではOpenTelemetry Collectorはサイドカーとして動作させるのが良いと思います。
main.go
package main

import (
	"context"
	"log"
	"net/http"
	"os"
	"time"

	"go.opentelemetry.io/contrib/instrumentation/net/http/otelhttp"
	"go.opentelemetry.io/otel"
	"go.opentelemetry.io/otel/exporters/otlp/otlptrace"
	"go.opentelemetry.io/otel/exporters/otlp/otlptrace/otlptracegrpc"
	"go.opentelemetry.io/otel/propagation"
	"go.opentelemetry.io/otel/sdk/resource"
	sdktrace "go.opentelemetry.io/otel/sdk/trace"
	semconv "go.opentelemetry.io/otel/semconv/v1.4.0"
	"go.opentelemetry.io/otel/trace"
	"google.golang.org/grpc"
)

var tracer = otel.Tracer("demo-server")

func initProvider(ctx context.Context) func() {
	res, err := resource.New(ctx,
		resource.WithFromEnv(),
		resource.WithProcess(),
		resource.WithTelemetrySDK(),
		resource.WithHost(),
		resource.WithAttributes(
			// the service name used to display traces in backends
			semconv.ServiceNameKey.String("demo-server"),
		),
	)
	handleErr(err, "failed to create resource")

	otelAgentAddr, ok := os.LookupEnv("OTEL_EXPORTER_OTLP_ENDPOINT")
	if !ok {
		otelAgentAddr = "0.0.0.0:4317"
	}

	traceClient := otlptracegrpc.NewClient(
		otlptracegrpc.WithInsecure(),
		otlptracegrpc.WithEndpoint(otelAgentAddr),
		otlptracegrpc.WithDialOption(grpc.WithBlock()))
	traceExp, err := otlptrace.New(ctx, traceClient)
	handleErr(err, "Failed to create the collector trace exporter")

	bsp := sdktrace.NewBatchSpanProcessor(traceExp)
	tracerProvider := sdktrace.NewTracerProvider(
		sdktrace.WithSampler(sdktrace.AlwaysSample()),
		sdktrace.WithResource(res),
		sdktrace.WithSpanProcessor(bsp),
	)

	// set global propagator to tracecontext (the default is no-op).
	otel.SetTextMapPropagator(propagation.NewCompositeTextMapPropagator(propagation.TraceContext{}, propagation.Baggage{}))
	otel.SetTracerProvider(tracerProvider)

	return func() {
		cxt, cancel := context.WithTimeout(ctx, time.Second)
		defer cancel()
		if err := traceExp.Shutdown(cxt); err != nil {
			otel.Handle(err)
		}
	}
}

func handleErr(err error, message string) {
	if err != nil {
		log.Fatalf("%s: %v", message, err)
	}
}

func main() {
	ctx := context.Background()

	shutdown := initProvider(ctx)
	defer shutdown()

	hello := http.HandlerFunc(func(w http.ResponseWriter, req *http.Request) {
		log.Print("/hello world")
		if _, err := w.Write([]byte("hello world")); err != nil {
			http.Error(w, "write operation failed.", http.StatusInternalServerError)
		}
	})

	google := http.HandlerFunc(func(w http.ResponseWriter, req *http.Request) {
		log.Print("/api/google")
		if err := httpRequest(req.Context(), "https://www.google.com"); err != nil {
			log.Printf("error: %v", err)
		}
		if _, err := w.Write([]byte("success to request Google")); err != nil {
			http.Error(w, "write operation failed.", http.StatusInternalServerError)
		}
	})

	mux := http.NewServeMux()
	mux.Handle("/hello", otelhttp.NewHandler(hello, "/hello"))
	mux.Handle("/api/google", otelhttp.NewHandler(google, "/api/google"))
	server := &http.Server{
		Addr: ":8080",
		Handler: otelhttp.NewHandler(mux, "server",
			otelhttp.WithMessageEvents(otelhttp.ReadEvents, otelhttp.WriteEvents),
		),
		ReadHeaderTimeout: 20 * time.Second,
	}

	if err := server.ListenAndServe(); err != http.ErrServerClosed {
		handleErr(err, "server failed to serve")
	}
}

func httpRequest(ctx context.Context, url string) error {
	var span trace.Span
	ctx, span = tracer.Start(ctx, "httpRequest")
	defer span.End()

	req, err := http.NewRequestWithContext(ctx, http.MethodGet, url, http.NoBody)
	if err != nil {
		return err
	}

	client := &http.Client{Transport: otelhttp.NewTransport(http.DefaultTransport)}
	res, err := client.Do(req)
	if err != nil {
		return err
	}
	defer res.Body.Close()

	return nil
}
少し長いですがやっていることはシンプルで、OpenTelemetryをセットアップしてHTTPサーバを起動しているだけです。/helloと/api/googleの2つのエンドポイントを用意しています。
otelAgentAddrにOpenTelemetry Collectorをエクスポート先として指定しています。ポート4317を指定するとgRPCで通信します。OpenTelemetry CollectorはHTTP/gRPCに対応しており4318を指定するとHTTPで通信します。
config.yml
receivers:
  otlp:
    protocols:
      grpc:

processors:
  attributes:
    actions:
      - key: collector
        value: otel-collector
        action: insert

  tail_sampling:
    decision_wait: 10s
    num_traces: 10
    policies:
      [
        {
          name: longer-than-500ms,
          type: latency,
          latency: { threshold_ms: 500 },
        },
        {
          type: string_attribute,
          string_attribute: {
            key: "http.url",
            values: ["https://www.google.co.jp"]
          }
        }
      ]

exporters:
  jaeger:
    endpoint: jaeger:14250
    tls:
      insecure: true

service:
  pipelines:
    traces:
      receivers: [otlp]
      processors: [attributes, tail_sampling]
      exporters: [jaeger]
  telemetry:
    logs:
      level: "debug"
OpenTelemetry Collectorの設定ファイルです。今回のメインですので上から順に説明していきます。
receivers
どこからどのようにデータを取得するかを設定します。今回はOpenTelemetryで取得したテレメトリーデータをgRPCで取得するので以下のようになります。
receivers:
  otlp:
    protocols:
      grpc:
processors
取得したデータを加工、サンプリングします。今回はattributesとしてcollector:otel-collectorを追加して、Tail-basedなサンプリングを実施しています。
processors:
  attributes:
    actions:
      - key: collector
        value: otel-collector
        action: insert

  tail_sampling:
    decision_wait: 10s
    num_traces: 10
    policies:
      [
        {
          name: longer-than-500ms,
          type: latency,
          latency: { threshold_ms: 500 },
        },
        {
          type: string_attribute,
          string_attribute: {
            key: "http.url",
            values: ["https://www.google.co.jp"]
          }
        }
      ]
サンプリング条件としてはレイテンシ500ms以上またはhttp.urlがhttps://www.google.co.jpになります。このようにtail_samplingは複数のpolicyを組み合わせることが可能で、その場合はどれか一つのpolicyに合致していればサンプリングされます。
processorsでは他にも色々できるので詳しくは公式ドキュメントをご確認ください。
またtail_samplingについても以下にドキュメントが用意されています。
exporters
今回はJaegerにエクスポートするので以下のように設定しています。
exporters:
  jaeger:
    endpoint: jaeger:14250
    tls:
      insecure: true
ちなみに今回の主題とは少しずれますがJaegerの公式に各ポートの説明が書かれていて参考になりました(Jaegerはポート多すぎてよく分からないまま設定していたので)。
service
どのコンポーネントを有効にするかを設定します。telemetry.logs.levelを設定するとtail_samplingでトレースをsamplingしたかをログに出力してくれるので手元で確認する時は便利です。
service:
  pipelines:
    traces:
      receivers: [otlp]
      processors: [attributes, tail_sampling]
      exporters: [jaeger]
  telemetry:
    logs:
      level: "debug"
動作確認
/helloと/api/googleにそれぞれ一度ずつリクエストを投げました。
% curl http://localhost:8080/hello
hello world
% curl http://localhost:8080/api/google
success to request Google
2023-08-26T22:44:30.811Z        debug   tailsamplingprocessor@v0.83.0/processor.go:171  Sampling Policy Evaluation ticked       {"kind": "processor", "name": "tail_sampling", "pipeline": "traces"}
2023-08-26T22:44:30.811Z        debug   sampling/latency.go:32  Evaluating spans in latency filter      {"kind": "processor", "name": "tail_sampling", "pipeline": "traces", "policy": "latency"}
2023-08-26T22:44:30.811Z        debug   sampling/string_tag_filter.go:95        Evaluting spans in string-tag filter    {"kind": "processor", "name": "tail_sampling", "pipeline": "traces", "policy": "string_attribute"}
2023-08-26T22:44:30.813Z        debug   tailsamplingprocessor@v0.83.0/processor.go:201  Sampling policy evaluation completed    {"kind": "processor", "name": "tail_sampling", "pipeline": "traces", "batch.len": 1, "sampled": 0, "notSampled": 2, "droppedPriorToEvaluation": 0, "policyEvaluationErrors": 0}
2023-08-26T22:44:31.811Z        debug   tailsamplingprocessor@v0.83.0/processor.go:171  Sampling Policy Evaluation ticked       {"kind": "processor", "name": "tail_sampling", "pipeline": "traces"}
2023-08-26T22:44:31.811Z        debug   tailsamplingprocessor@v0.83.0/processor.go:201  Sampling policy evaluation completed    {"kind": "processor", "name": "tail_sampling", "pipeline": "traces", "batch.len": 0, "sampled": 0, "notSampled": 0, "droppedPriorToEvaluation": 0, "policyEvaluationErrors": 0}
2023-08-26T22:44:32.811Z        debug   tailsamplingprocessor@v0.83.0/processor.go:171  Sampling Policy Evaluation ticked       {"kind": "processor", "name": "tail_sampling", "pipeline": "traces"}
2023-08-26T22:44:32.812Z        debug   tailsamplingprocessor@v0.83.0/processor.go:201  Sampling policy evaluation completed    {"kind": "processor", "name": "tail_sampling", "pipeline": "traces", "batch.len": 0, "sampled": 0, "notSampled": 0, "droppedPriorToEvaluation": 0, "policyEvaluationErrors": 0}
2023-08-26T22:44:33.813Z        debug   tailsamplingprocessor@v0.83.0/processor.go:171  Sampling Policy Evaluation ticked       {"kind": "processor", "name": "tail_sampling", "pipeline": "traces"}
2023-08-26T22:44:33.813Z        debug   tailsamplingprocessor@v0.83.0/processor.go:201  Sampling policy evaluation completed    {"kind": "processor", "name": "tail_sampling", "pipeline": "traces", "batch.len": 0, "sampled": 0, "notSampled": 0, "droppedPriorToEvaluation": 0, "policyEvaluationErrors": 0}
2023-08-26T22:44:34.813Z        debug   tailsamplingprocessor@v0.83.0/processor.go:171  Sampling Policy Evaluation ticked       {"kind": "processor", "name": "tail_sampling", "pipeline": "traces"}
2023-08-26T22:44:34.813Z        debug   tailsamplingprocessor@v0.83.0/processor.go:201  Sampling policy evaluation completed    {"kind": "processor", "name": "tail_sampling", "pipeline": "traces", "batch.len": 0, "sampled": 0, "notSampled": 0, "droppedPriorToEvaluation": 0, "policyEvaluationErrors": 0}
2023-08-26T22:44:35.809Z        debug   tailsamplingprocessor@v0.83.0/processor.go:171  Sampling Policy Evaluation ticked       {"kind": "processor", "name": "tail_sampling", "pipeline": "traces"}
2023-08-26T22:44:35.809Z        debug   sampling/latency.go:32  Evaluating spans in latency filter      {"kind": "processor", "name": "tail_sampling", "pipeline": "traces", "policy": "latency"}
2023-08-26T22:44:35.809Z        debug   sampling/string_tag_filter.go:95        Evaluting spans in string-tag filter    {"kind": "processor", "name": "tail_sampling", "pipeline": "traces", "policy": "string_attribute"}
2023-08-26T22:44:35.810Z        debug   tailsamplingprocessor@v0.83.0/processor.go:201  Sampling policy evaluation completed    {"kind": "processor", "name": "tail_sampling", "pipeline": "traces", "batch.len": 1, "sampled": 2, "notSampled": 0, "droppedPriorToEvaluation": 0, "policyEvaluationErrors": 0}
/helloへのリクエストはレイテンシが500ms未満、かつGoogleにリクエストを送っていないのでnotSampled: 2となっています。2となっているのはpolicyを2個設定しているからです。
tailsamplingprocessor@v0.83.0/processor.go:201 Sampling policy evaluation completed {"kind": "processor", "name": "tail_sampling", "pipeline": "traces", "batch.len": 1, "sampled": 0, "notSampled": 2, "droppedPriorToEvaluation": 0, "policyEvaluationErrors": 0}
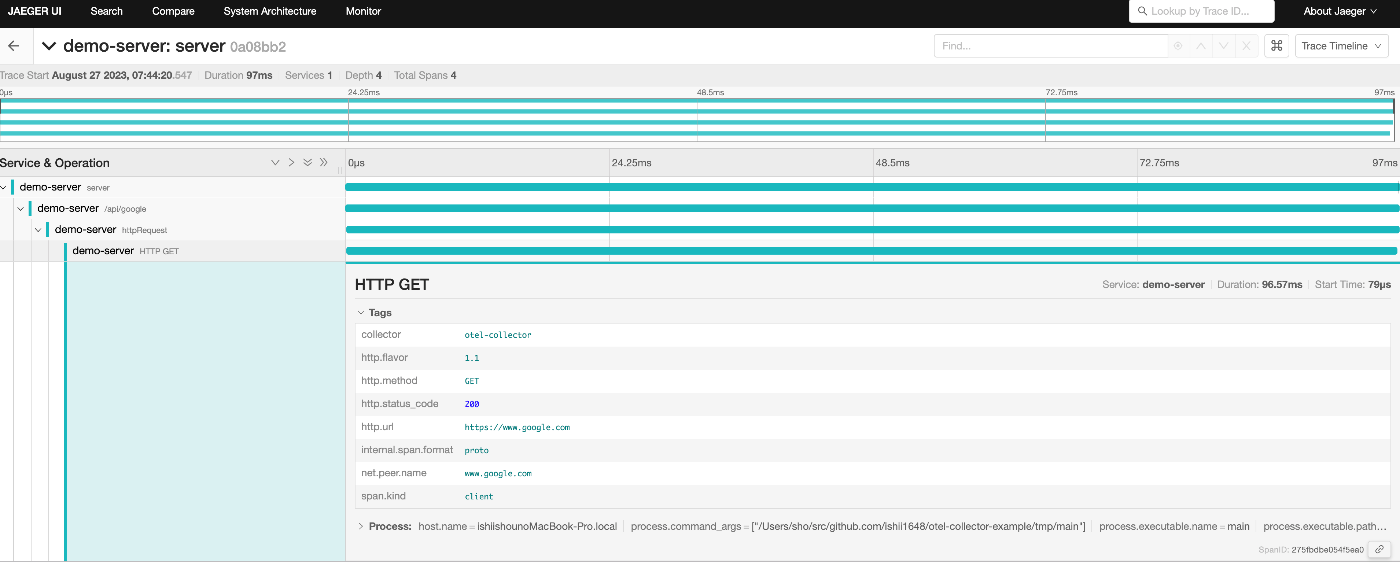
/api/googleへのリクエストはトレースにhttp.url: https://www.google.comが含まれているのでサンプリングされています。
tailsamplingprocessor@v0.83.0/processor.go:201 Sampling policy evaluation completed {"kind": "processor", "name": "tail_sampling", "pipeline": "traces", "batch.len": 1, "sampled": 2, "notSampled": 0, "droppedPriorToEvaluation": 0, "policyEvaluationErrors": 0}
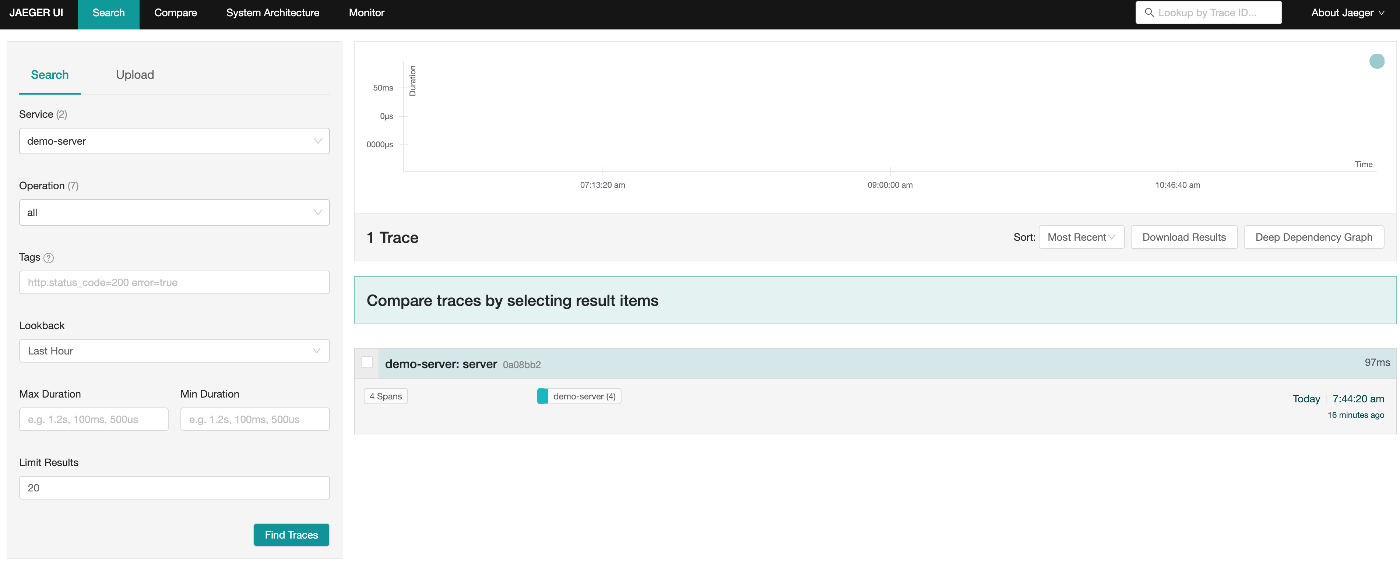
Jaegerでも/api/googleへのリクエストのみが確認できます。
おわりに
OpenTelemetryは非常に便利なツールですが、すべてのトレースをバックエンドに送るとコスト面が許容できず、ランダム・サンプリングにすると欲しいトレースが無いケースが多々あり悩ましい問題でしたがOpenTelemetry Collectorを導入することでコストを抑えつつ欲しいトレースは確実にサンプリングできるようになります。
設定の表現力が高いので学習コストが高そうですが、その分ドキュメントも手厚く用意されているのでそれほど詰まるところも無い印象でした。
Discussion