COCO jsonからBBox/Maskを抽出して可視化
COCO形式でAnnotation情報を格納したjsonからSegmentation Maskを作成したり、それを用いてデータを可視化するツールです。
すぐコピペで使える感じのが見当たらないのでここに書き留めておきます。
できること
- Annotationに書いてある内容の確認
- 画像へAnnotationのBBoxとMaskを合成
- Maskを画像情報として書き出し
プログラム全体
import io
import json
import textwrap

from PIL import Image, ImageDraw
import numpy as np
from pycocotools.coco import COCO
import matplotlib.pyplot as plt

PALETTE = [
    [0, 192, 64], [0, 192, 64], [0, 64, 96], [128, 192, 192],
    [0, 64, 64], [0, 192, 224], [0, 192, 192], [128, 192, 64],
    [0, 192, 96], [128, 192, 64], [128, 32, 192], [0, 0, 224],
    [0, 0, 64], [0, 160, 192], [128, 0, 96], [128, 0, 192],
    [0, 32, 192], [128, 128, 224], [0, 0, 192], [128, 160, 192],
    [128, 128, 0], [128, 0, 32], [128, 32, 0], [128, 0, 128],
    [64, 128, 32], [0, 160, 0], [0, 0, 0], [192, 128, 160],
    [0, 32, 0], [0, 128, 128], [64, 128, 160], [128, 160, 0],
    [0, 128, 0], [192, 128, 32], [128, 96, 128], [0, 0, 128],
    [64, 0, 32], [0, 224, 128], [128, 0, 0], [192, 0, 160],
    [0, 96, 128], [128, 128, 128], [64, 0, 160], [128, 224, 128],
    [128, 128, 64], [192, 0, 32], [128, 96, 0], [128, 0, 192],
    [0, 128, 32], [64, 224, 0], [0, 0, 64], [128, 128, 160],
    [64, 96, 0], [0, 128, 192], [0, 128, 160], [192, 224, 0],
    [0, 128, 64], [128, 128, 32], [192, 32, 128], [0, 64, 192],
    [0, 0, 32], [64, 160, 128], [128, 64, 64], [128, 0, 160],
    [64, 32, 128], [128, 192, 192], [0, 0, 160], [192, 160, 128],
    [128, 192, 0], [128, 0, 96], [192, 32, 0], [128, 64, 128],
    [64, 128, 96], [64, 160, 0], [0, 64, 0], [192, 128, 224],
    [64, 32, 0], [0, 192, 128], [64, 128, 224], [192, 160, 0],
    [0, 192, 0], [192, 128, 96], [192, 96, 128], [0, 64, 128],
    [64, 0, 96], [64, 224, 128], [128, 64, 0], [192, 0, 224],
    [64, 96, 128], [128, 192, 128], [64, 0, 224], [192, 224, 128],
    [128, 192, 64], [192, 0, 96], [192, 96, 0], [128, 64, 192],
    [0, 128, 96], [0, 224, 0], [64, 64, 64], [128, 128, 224],
    [0, 96, 0], [64, 192, 192], [0, 128, 224], [128, 224, 0],
    [64, 192, 64], [128, 128, 96], [128, 32, 128], [64, 0, 192],
    [0, 64, 96], [0, 160, 128], [192, 0, 64], [128, 64, 224],
    [0, 32, 128], [192, 128, 192], [0, 64, 224], [128, 160, 128],
    [192, 128, 0], [128, 64, 32], [128, 32, 64], [192, 0, 128],
    [64, 192, 32], [0, 160, 64], [64, 0, 0], [192, 192, 160],
    [0, 32, 64], [64, 128, 128], [64, 192, 160], [128, 160, 64],
    [64, 128, 0], [192, 192, 32], [128, 96, 192], [64, 0, 128],
    [64, 64, 32], [0, 224, 192], [192, 0, 0], [192, 64, 160],
    [0, 96, 192], [192, 128, 128], [64, 64, 160], [128, 224, 192],
    [192, 128, 64], [192, 64, 32], [128, 96, 64], [192, 0, 192],
    [0, 192, 32], [64, 224, 64], [64, 0, 64], [128, 192, 160],
    [64, 96, 64], [64, 128, 192], [0, 192, 160], [192, 224, 64],
    [64, 128, 64], [128, 192, 32], [192, 32, 192], [64, 64, 192],
    [0, 64, 32], [64, 160, 192], [192, 64, 64], [128, 64, 160],
    [64, 32, 192], [192, 192, 192], [0, 64, 160], [192, 160, 192],
    [192, 192, 0], [128, 64, 96], [192, 32, 64], [192, 64, 128],
    [64, 192, 96], [64, 160, 64], [64, 64, 0],
    ]  # COCO-Stuff dataset patlette


def annotation_summary(path: str):
    print("summary --------------------------------------------------")
    print("- file path")
    print(f"\t {path}")
    print()

    txtst = textwrap.TextWrapper(width=50, max_lines=1, placeholder=" ...")
    with open(path) as f:
        file = json.load(f)

    try:
        info = file["info"]
        print("- INFO section")
        for k, v in info.items():
            print(f"\t {k.ljust(16)}: {v}")
        print()
    except KeyError:
        print("[WARNING] not exist INFO section")
        print()

    try:
        cat = file["categories"]
        print("- CATEGORIS section")
        for c in cat:
            for k, v in c.items():
                print(f"\t {k.ljust(16)}: {txtst.fill(str(v))}")
            print("\t ---")
        print()
    except KeyError:
        print("[WARNING] not exist CATEGORIS section")
        print()

    try:
        img = file["images"]
        img_n = len(img)
        print(f"- IMAGES length: {img_n}")
        img_sample = img[0]
        print("- IMAGES sample")
        for k, v in img_sample.items():
            print(f"\t {k.ljust(16)}: {v}")
        print()
    except KeyError:
        print("[WARNING] not exist IMAGES section")
        print()

    try:
        anns = file["annotations"]
        anns_n = len(anns)
        print(f"- ANNOTATION length: {anns_n}")
        anns_sample = anns[0]
        print("- ANNOTATIONS sample")
        for k, v in anns_sample.items():
            print(f"\t {k.ljust(16)}: {txtst.fill(str(v))}")
        print()
    except KeyError:
        print("[WARNING] not exist ANNOTATIONS section")
        print()

    print("---------------------------------------------------------")
    return None


def extract_id(path: str):
    img_id: list[int] = []
    with open(path) as f:
        for img_data in json.load(f)["images"]:
            img_id += [img_data["id"]]
    return img_id


def visiualize_annotation(img_id: int, path=None, img_dir=None, coco=None):
    print(f"- add segmentaion mask to original image")
    if coco == None:
        coco = COCO(path)

    img_data = coco.imgs[img_id]
    cat_ids = coco.getCatIds()
    anns_ids = coco.getAnnIds(imgIds=img_data['id'], catIds=cat_ids, iscrowd=None)
    anns = coco.loadAnns(anns_ids)

    img = np.array(Image.open(img_dir + "/" + img_data['file_name']))
    plt.figure(figsize=(img_data["width"]/100, img_data["height"]/100), dpi=100)
    plt.subplots_adjust(left=0, right=1, bottom=0, top=1)
    plt.imshow(img)
    coco.showAnns(anns)  # ploting to current fig and ax

    buf = io.BytesIO()
    plt.savefig(buf, format="png")  # save fig to buffer in order to save PIL image
    plt.close()
    buf.seek(0)
    img = Image.open(buf).convert('RGB').resize((img_data["width"], img_data["height"]))

    img_drawer = ImageDraw.Draw(img)
    for i, a in enumerate(anns):
        x, y, w, h = a["bbox"]
        color = PALETTE[a["category_id"]]
        img_drawer.rectangle([(x,y),(x+w, y+h)], outline=tuple(color), width=2)
    return img


def annotation_to_mask(img_id: int, path=None, coco=None):
    print(f"- make segmentaion mask from annotaion")

    if coco == None:
        coco = COCO(path)
    img_data = coco.imgs[img_id]
    print(f"load image from: {img_data['file_name']}")

    cat_ids = coco.getCatIds()
    anns_ids = coco.getAnnIds(imgIds=img_data['id'], catIds=cat_ids, iscrowd=None)
    anns = coco.loadAnns(anns_ids)
    mask = coco.annToMask(anns[0])  # sampling annotation mask from anno_id 0 as a canvas.
    mask = np.stack([mask, mask, mask], axis=2) * 0  # dim = 2 -> [h,w,3]

    for i, a in enumerate(anns):
        color = PALETTE[a["category_id"]]
        one_mask = np.where(coco.annToMask(a) > 0, 1, 0)
        one_mask = np.stack([one_mask * color[0], one_mask * color[1], one_mask * color[2]], axis=2)
        mask = np.where(one_mask > 0, one_mask, mask)  # overlap non-zero mask on previous mask
    mask = Image.fromarray(np.uint8(mask))
    return mask
Annotationデータの要約
annotationのjsonファイルをエディタで開くと重くて仕方ないので、コマンドラインから一発で全体像を見たいときに使える。
行っていることは至極単純で、jsonをdictとして読み込み、整形して表示してるだけ。
データセットの最も大きい部分、つまり画像やコンテンツの部分は、1つだけ切り出して確認するようになっている。
データセットはこれを利用させてもらった。
import json
import textwrap

def annotation_summary(path: str):
    print("summary --------------------------------------------------")
    print("- file path")
    print(f"\t {path}")
    print()

    txtst = textwrap.TextWrapper(width=50, max_lines=1, placeholder=" ...")
    with open(path) as f:
        file = json.load(f)

    try:
        info = file["info"]
        print("- INFO section")
        for k, v in info.items():
            print(f"\t {k.ljust(16)}: {v}")
        print()
    except KeyError:
        print("[WARNING] not exist INFO section")
        print()

    try:
        cat = file["categories"]
        print("- CATEGORIS section")
        for c in cat:
            for k, v in c.items():
                print(f"\t {k.ljust(16)}: {txtst.fill(str(v))}")
            print("\t ---")
        print()
    except KeyError:
        print("[WARNING] not exist CATEGORIS section")
        print()

    try:
        img = file["images"]
        img_n = len(img)
        print(f"- IMAGES length: {img_n}")
        img_sample = img[0]
        print("- IMAGES sample")
        for k, v in img_sample.items():
            print(f"\t {k.ljust(16)}: {v}")
        print()
    except KeyError:
        print("[WARNING] not exist IMAGES section")
        print()

    try:
        anns = file["annotations"]
        anns_n = len(anns)
        print(f"- ANNOTATION length: {anns_n}")
        anns_sample = anns[0]
        print("- ANNOTATIONS sample")
        for k, v in anns_sample.items():
            print(f"\t {k.ljust(16)}: {txtst.fill(str(v))}")
        print()
    except KeyError:
        print("[WARNING] not exist ANNOTATIONS section")
        print()

    print("---------------------------------------------------------")
    return None
例えばlivecell Dataset 2021だと次のように表示できる。
>>> path = "/workspace/mmsegmentation/dataset/annotation/livecell_annotations_val.json"
>>> annotation_summary(path)
summary --------------------------------------------------
- file path
         /workspace/mmsegmentation/dataset/annotation/livecell_annotations_val.json

[WARNING] not exist INFO section

- CATEGORIS section
         name            : a172
         id              : 0
         ---
         name            : bt474
         id              : 1
         ---
         name            : bv2
         id              : 2
         ---
         name            : huh7
         id              : 3
         ---
         name            : mcf7
         id              : 4
         ---
         name            : shsy5y
         id              : 5
         ---
         name            : skbr3
         id              : 6
         ---
         name            : skov3
         id              : 7
         ---

- IMAGES length: 570
- IMAGES sample
         url             : https://darwin.v7labs.com/api/images/47188/original
         height          : 520
         width           : 704
         id              : 229517
         tif_file_name   : A172_Phase_A7_2_03d00h00m_2.tif
         file_name       : livecell_train_val_images/A172/A172_Phase_A7_2_03d00h00m_2.png

- ANNOTATION length: 181610
- ANNOTATIONS sample
         segmentation    : [[0.43, 129.35, 0.0, 185.34, 1.78, 185.34, ...
         area            : 783.0356000000011
         iscrowd         : 0
         image_id        : 229517
         bbox            : [0.0, 129.35, 18.94, 55.99000000000001]
         category_id     : 0
         id              : 229518

---------------------------------------------------------
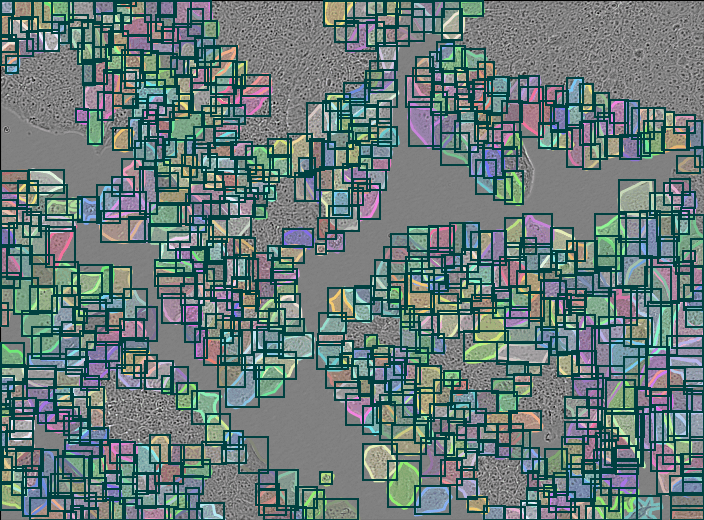
画像へBBoxとMaskを描写
これは調べればすぐに出てくるものだが、BBoxもついでに可視化して画像で保存できるようにした。
-
img_id: Annotationにある画像のID番号 → この画像を可視化する -
path: pycocotoolsでjsonを読み込む場合入れる -
img_dir: jsonにあるpathで画像が格納されたディレクトリのprefixになる -
coco:COCO(path)で読み込んだものが事前にあればpathなどを省略できる
やっていることとしては、COCOで読み込んだデータから画像と対応するAnnotationを引っ張ってきて、pyplotの直接インターフェイスを使ってcoco.showAnnsでMaskを描写したfigを作成、これをPIL Imageに移してBBoxを描写している。
BBoxの色はカテゴリごとに別々のものを振っている。パレットは上のプログラム全体に記載。
Maskの色がバラバラなのはなんとかしたかった...
import io
from PIL import Image, ImageDraw
import numpy as np
from pycocotools.coco import COCO
import matplotlib.pyplot as plt

def visiualize_annotation(img_id: int, path=None, img_dir=None, coco=None):
    print(f"- add segmentaion mask to original image")
    if coco == None:
        coco = COCO(path)

    img_data = coco.imgs[img_id]
    cat_ids = coco.getCatIds()
    anns_ids = coco.getAnnIds(imgIds=img_data['id'], catIds=cat_ids, iscrowd=None)
    anns = coco.loadAnns(anns_ids)

    img = np.array(Image.open(img_dir + "/" + img_data['file_name']))
    plt.figure(figsize=(img_data["width"]/100, img_data["height"]/100), dpi=100)
    plt.subplots_adjust(left=0, right=1, bottom=0, top=1)
    plt.imshow(img)
    coco.showAnns(anns)  # ploting to current fig and ax

    buf = io.BytesIO()
    plt.savefig(buf, format="png")  # save fig to buffer in order to save PIL image
    plt.close()
    buf.seek(0)
    img = Image.open(buf).convert('RGB').resize((img_data["width"], img_data["height"]))

    img_drawer = ImageDraw.Draw(img)
    for i, a in enumerate(anns):
        x, y, w, h = a["bbox"]
        color = PALETTE[a["category_id"]]
        img_drawer.rectangle([(x,y),(x+w, y+h)], outline=tuple(color), width=2)
    return img
実行は次のように
>>> id = extract_id(path)[300]  # select id from index of dict, e.g. idx 300 -> id 499020
>>> coco = COCO(path)
>>> fig = visiualize_annotation(id, img_dir="dataset" ,coco=coco)
>>> fig.save("sample.png")
画像はこんな感じに出てくる。

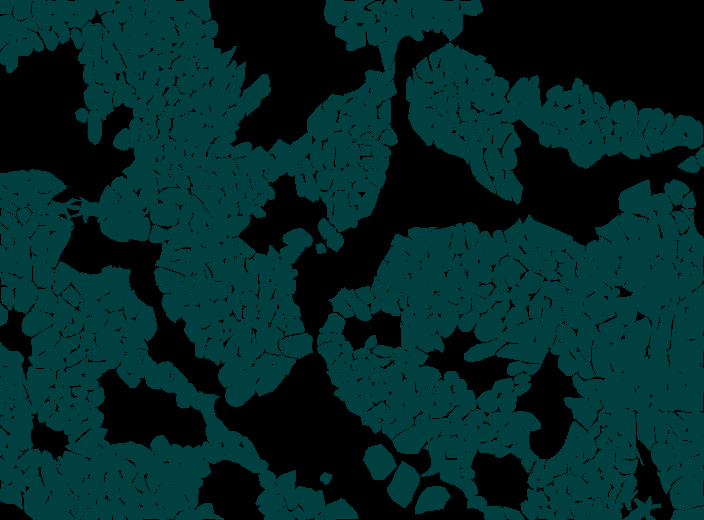
Segmentation Maskの作成
jsonから画像へ変換する。
ほとんどvisiualize_annotationの通りだが、Maskの色をパレットで揃えており、MMSegmentaionのCOCOStuffDatasetのフォーマットへ変換することが可能になっている。
from PIL import Image, ImageDraw
import numpy as np
from pycocotools.coco import COCO

def annotation_to_mask(img_id: int, path=None, coco=None):
    print(f"- make segmentaion mask from annotaion")

    if coco == None:
        coco = COCO(path)
    img_data = coco.imgs[img_id]
    print(f"load image from: {img_data['file_name']}")

    cat_ids = coco.getCatIds()
    anns_ids = coco.getAnnIds(imgIds=img_data['id'], catIds=cat_ids, iscrowd=None)
    anns = coco.loadAnns(anns_ids)
    mask = coco.annToMask(anns[0])  # sampling annotation mask from anno_id 0 as a canvas.
    mask = np.stack([mask, mask, mask], axis=2) * 0  # dim = 2 -> [h,w,3]

    for i, a in enumerate(anns):
        color = PALETTE[a["category_id"]]
        one_mask = np.where(coco.annToMask(a) > 0, 1, 0)
        one_mask = np.stack([one_mask * color[0], one_mask * color[1], one_mask * color[2]], axis=2)
        mask = np.where(one_mask > 0, one_mask, mask)  # overlap non-zero mask on previous mask
    mask = Image.fromarray(np.uint8(mask))
    return mask
実行は次のように
>>> mask = annotation_to_mask(id, coco=coco)
>>> mask.save("sample.png")
実際の画像はこんな感じに出てくる。この画像では1つしかカテゴリが写っていないが、Maskごとのカテゴリでパレットカラーは別れている。

本当はMask画像からjsonのポリゴンを作成するものも作ろうと試みたのだが、複雑な形状だとうまく行かなかったので今後なんとかする...

Discussion