【Rust】Hello egui: eguiを動かす
Prerequisites: 前提条件
この記事を読むには Rust の以下の知識が少なくとも必要です.
- Rust の関数,クロージャ,所有権を知っていること.
- Cargo.toml で外部クレートが呼び出せる.
この記事は?
Rust で egui を動かすだけの記事です.
egui クレートについて:
egui とは?
egui クレートについては以下のドキュメントや,検索すればかなり情報が出ていると思います.
一言で言えば,egui: an easy-to-use GUI in pure Rust!と紹介されています.
egui は,ネイティブ開発か,ウェブ開発で利用できます.
例えば,ブラウザ上で動くdemoはこんな感じです.
Quick Start: Hello egui
Cargo.toml に 外部 crate を追加する必要があります:
eframe: the egui framework crate を追加する必要があるので,コマンドで検索しましょう.
$ cargo search eframe
サーチした結果,eframe の最新バージョンが出てくると思います.
これを追加します.
[dependencies]
eframe = "0.30.0"
eframe の crate のドキュメントを見ましょう:
$ cargo doc --open
もしくは,https://docs.rs/eframe/latest/eframe/index.html に直接アクセスしましょう.
eframeのドキュメントを見ると,以下の項目があります.
Simplified usage:
If your app is only for native, and you don’t need advanced features like state persistence, then you can use the simpler function run_simple_native.
今回はネイティブ開発で,最小限のコードから使い方を学ぶことを目的としているので,この項目を使います.
run_simple_nativeのリンクに飛び,このExampleを利用しましょう.
use eframe::egui;

fn main() -> eframe::Result {
    // Our application state:
    let mut name = "Arthur".to_owned();
    let mut age = 42;

    let options = eframe::NativeOptions::default();

    eframe::run_simple_native("My egui App", options, move |ctx, _frame| {
        egui::CentralPanel::default().show(ctx, |ui| {
            ui.heading("My egui Application");
            ui.horizontal(|ui| {
                let name_label = ui.label("Your name: ");
                ui.text_edit_singleline(&mut name)
                    .labelled_by(name_label.id);
            });
            ui.add(egui::Slider::new(&mut age, 0..=120).text("age"));
            if ui.button("Increment").clicked() {
                age += 1;
            }
            ui.label(format!("Hello '{name}', age {age}"));
        });
    })
}
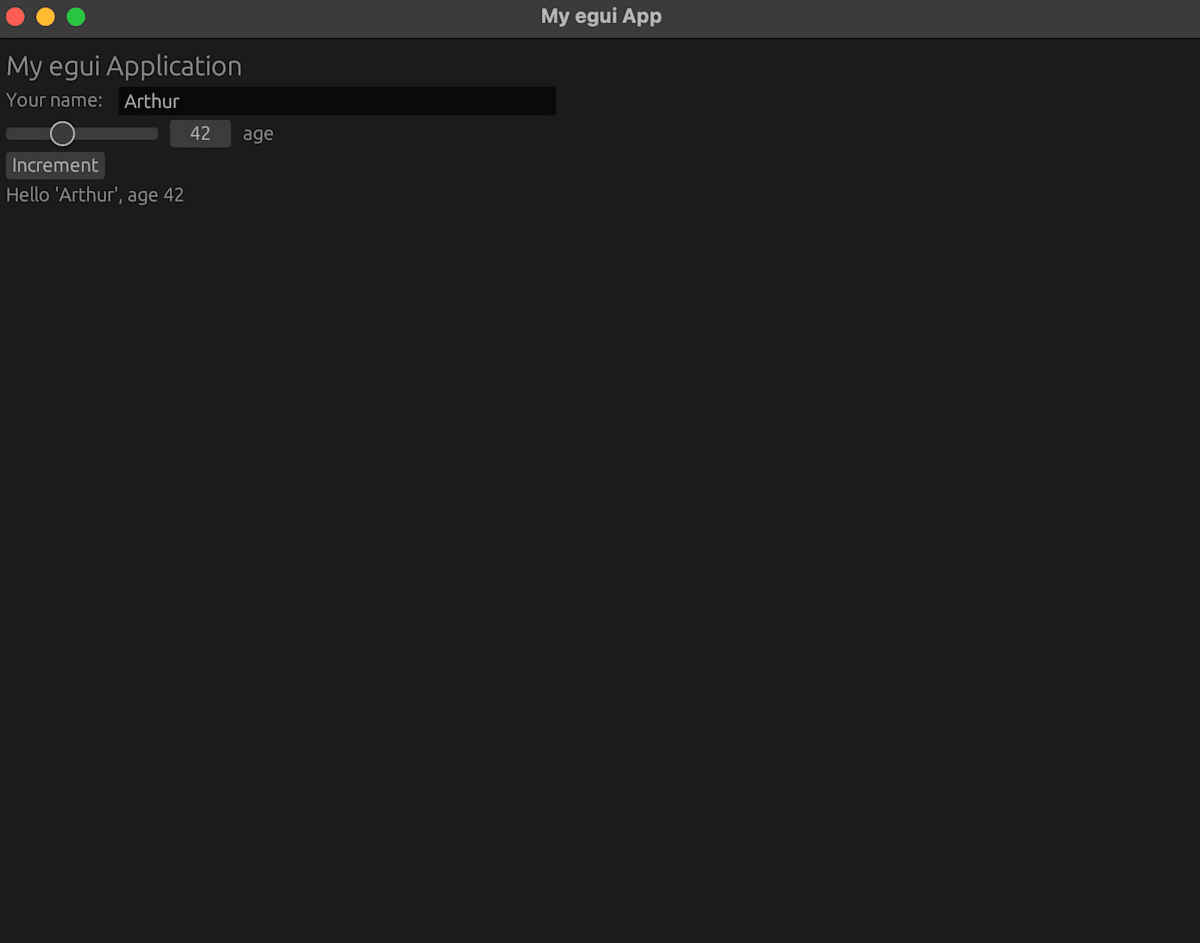
これを cargo run で実行して,以下のウィンドウが現れれば成功です.
コードを見ればわかることですが,egui でのレンダリングの基本は以下です:
let options = eframe::NativeOptions::default();

// pub fn run_simple_native(
//   app_name: &str,
//   native_options: NativeOptions,
//   update_fun: impl FnMut(&Context, &mut Frame) + 'static,
// ) -> Result
eframe::run_simple_native("My egui App", options, move |ctx, _frame| {

    // pub fn show<R>(
    //    self,
    //    ctx: &Context,
    //    add_contents: impl FnOnce(&mut Ui) -> R,
    // ) -> InnerResponse<R>
    egui::CentralPanel::default().show(ctx, |ui| {

        ui.heading("My egui Application");
        ui.horizontal(|ui| {
            let name_label = ui.label("Your name: ");
            ui.text_edit_singleline(&mut name)
                .labelled_by(name_label.id);
        });
        ui.add(egui::Slider::new(&mut age, 0..=120).text("age"));
        if ui.button("Increment").clicked() {
            age += 1;
        }
        ui.label(format!("Hello '{name}', age {age}"));
    });
})
FnMut はクロージャ(Closure)を参照のこと.
move は || で囲まれたキャプチャする変数の所有権をクロージャに移す命令のこと.
sin(x) のグラフを書いてみる
これだけでは味気ないので,sin カーブを描画してみましょう.
完成させるアプリケーションはスライダーで sin(X) の描画範囲を [0, Max X] までに設定できるものです.

ここで,グラフをプロットするために,eframe クレートだけでなく,egui_polot というクレートを新たに用います:
[dependencies]
eframe = "0.30.0"
egui_plot = "0.30.0"
先ほどのコードに対して,egui_plot クレートから,Plot, Line, PlotPoints を呼び出して用います.
use eframe::egui;
use egui_plot::{Plot, Line, PlotPoints};

fn main() -> eframe::Result {

    const MATHPI: f64 = std::f64::consts::PI;
    let mut sine_range = 2.0 * MATHPI;

    let options = eframe::NativeOptions::default();

    eframe::run_simple_native(
        "sine curve",
        options,
        move |ctx, _frame| {
            ctx.set_visuals(egui::Visuals::light()); // light mode
            egui::CentralPanel::default().show(ctx, |ui| {

            // スライダーを追加
            ui.add(egui::Slider::new(&mut sine_range, 0.0..=4.0*MATHPI).text("Max X"));

            // sine カーブのデータを作成(sine_range までの範囲)
            let sin: PlotPoints = (0..1000)
                .map(|i| {
                    let x = i as f64 * 0.001 * 4.0 * MATHPI;
                    (x, x.sin())
                })
                .take_while(|(x, _)| *x <= sine_range) // sine_range を超えたらストップ
                .map(|(x, y)| [x, y])
                .collect();

            let line = Line::new(sin);
            Plot::new("my_plot")
                .view_aspect(2.0)
                .include_x(0.0)
                .include_x(MATHPI * 4.0)
                .include_y(-1.0)
                .include_y(1.0)
                .show(ui, |plot_ui| plot_ui.line(line));
            });
    })
}
コードの詳細を見ていきましょう:
- 円周率の定義と描画範囲
f64 に用意された円周率を定数として呼び出しています.
これを用いて,描画範囲の初期値を設定しています.
const MATHPI: f64 = std::f64::consts::PI;
let mut sine_range = 2.0 * MATHPI;
- 背景の設定
今回はライトモードでの表示を行っています.
ctx.set_visuals(egui::Visuals::light()); // light mode
light() を dark() に変えれば,dark mode でのプロットになります.
- PlotPoints と Line の作成
まずは,sine カーブのデータを作成して,PlotPoints 構造体で定義された変数に格納します.
// sine カーブのデータを作成(sine_range までの範囲)
let sin: PlotPoints = (0..1000)
    .map(|i| {
        let x = i as f64 * 0.001 * 4.0 * MATHPI;
        (x, x.sin())
    })
    .take_while(|(x, _)| *x <= sine_range) // sine_range を超えたらストップ
    .map(|(x, y)| [x, y])
    .collect();
これで,XY座標の各点ごとの座標が得られたので,これを線で繋ぎます.
let line = Line::new(sin);
- Plot
最後に line 変数をプロットします.
Plot::new("my_plot")
    .view_aspect(2.0)
    .include_x(0.0)
    .include_x(MATHPI * 4.0)
    .include_y(-1.0)
    .include_y(1.0)
    .show(ui, |plot_ui| plot_ui.line(line));
まとめ
今回は Hello egui ということで,初めての Rust の egui を使った GUI アプリケーション開発の仕方について触れました.
Discussion