🎓
テキストからlangchainでナレッジグラフを作成し、networkxで可視化する。
テキストからlangchainを使用してナレッジグラフを作れるらしいので、どのくらいのものが作れるのか試しにやってみた。
Langchainのチュートリアルをそのまま使った。
使用ライブラリ
- networkx
- langchain-community
- langchain_openai
- matplotlib
- japanize_matplotlib
環境設定
from langchain_community.graphs.index_creator import GraphIndexCreator
from langchain_openai import OpenAI
import os
from dotenv import load_dotenv

load_dotenv()
API_KEY = os.environ['OPENAI_API_KEY']
GraphIndexCreatorのインスタンスを作成
index_creator = GraphIndexCreator(llm=OpenAI(temperature=0, openai_api_key=API_KEY))
今回使用する文は読解力問題でよく出るアミラーゼ問題を使用する。長文は今後また。。。
all_text = 'アミラーゼという酵素は、グルコースが繋がってできたデンプンを分解するが、同じグルコースからできていても、形が違うセルロースは分解できない'
テキストから知識グラフを生成
graph = index_creator.from_text(all_text)
生成されたグラフからトリプルを取得
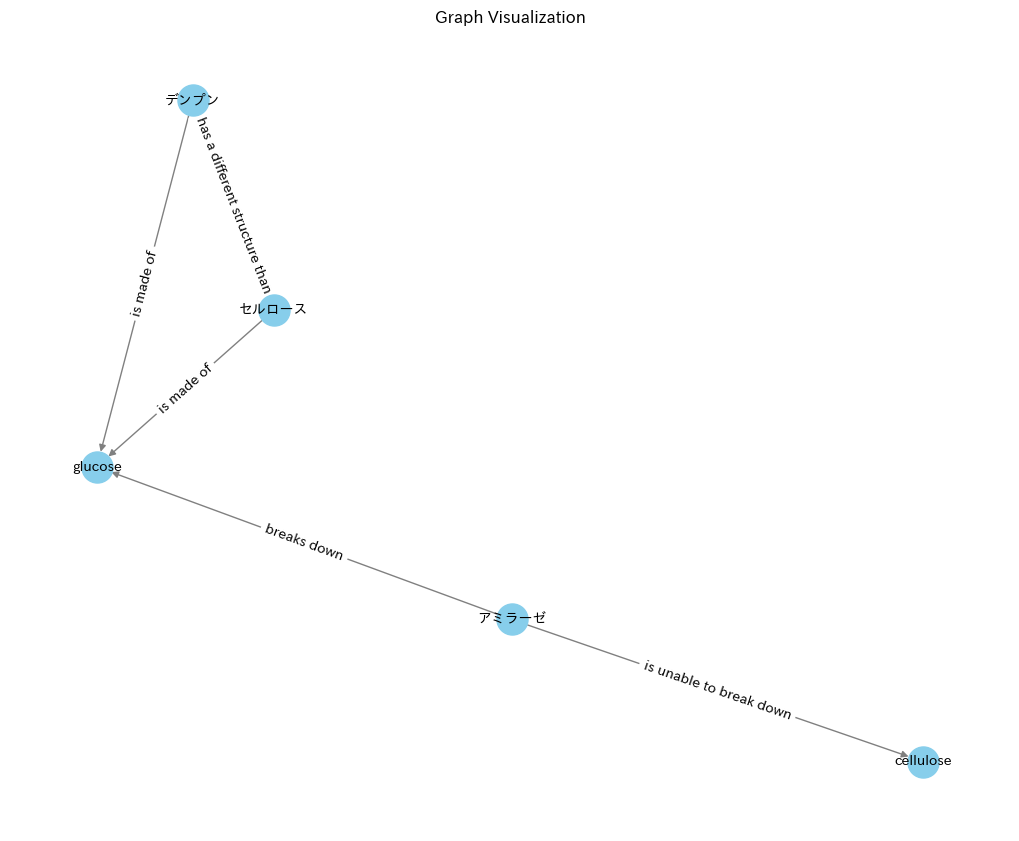
graph.get_triples()
[('アミラーゼ', 'glucose', 'breaks down'),
('アミラーゼ', 'cellulose', 'is unable to break down'),
('デンプン', 'glucose', 'is made of'),
('セルロース', 'glucose', 'is made of'),
('セルロース', 'デンプン', 'has a different structure than')]
できたグラフに対して問題をだす。
from langchain.chains import GraphQAChain

# GraphQAChainのインスタンスを作成
chain = GraphQAChain.from_llm(
    OpenAI(temperature=0, openai_api_key=API_KEY),
    graph=graph,
    verbose=True
)

# 問題
result = chain.run("セルロースは(A)と形が違う.(A)に当てはまる単語は?")
print(result)
Entering new GraphQAChain chain...
Entities Extracted:
セルロース
Full Context:
セルロース is made of glucose
セルロース has a different structure than デンプン
Finished chain.
デンプン
has a different structure thanが知識グラフの作成のときに生成されたので正解が出てきました。
(生成されなかったら正解はでるのか?)
グラフを保存
graph.write_to_gml("graph.gml")
グラフを可視化
import networkx as nx
import matplotlib.pyplot as plt
import japanize_matplotlib

# Load the graph from the GML file
graph = nx.read_gml("graph.gml")

# Visualize the graph
plt.figure(figsize=(10, 8))  # Adjust figure size as needed
pos = nx.spring_layout(graph)  # Use a layout algorithm (spring layout in this case)
nx.draw(graph, pos, with_labels=True, node_size=500, node_color="skyblue",font_family='IPAexGothic', font_size=10, font_weight="bold", edge_color="gray")
#エッジのテキスト表示
edge_labels = {(u, v): d['relation'] for u, v, d in graph.edges(data=True)}
nx.draw_networkx_edge_labels(graph, pos, edge_labels=edge_labels, font_family='IPAexGothic', font_size=10)

plt.title("Graph Visualization")
plt.show()
まとめ
人物相関図をつくりたいと考えているので、試しにやってみたが、とても簡単に作れた。長文がどうなるのかわからないがまたやってみる。
Discussion