【力学系超入門】平衡点の分岐:線形安定性解析【Python】
1. 力学系
力学系とは
力学系(Dynamical System)は、時間ともに動的に変化するシステムを意味する。力学系の目的は、システムの状態がどのように時間発展するかを理解し、そのパターンや特性を解析することである。
例えば、これまで以下のような分野で応用されてきた。
- 物理学:天体力学
- 工学:制御理論、電気回路
- 生物学:生態系のモデリング
- 経済学:市場のダイナミクス
上記の内容を見てわかる通り、力学系は連続時間の微分方程式と離散時間の差分方程式で数理モデル化されたシステムについて取り扱う。
この記事では力学系の分岐について説明する。元ネタは小室元政『新版 基礎からの力学系 分岐解析からカオス的遍歴へ』である。というか、この本を勉強しているときのノートを抜粋&整理したのがこの記事である(そのため、基本的な流れや記述が大きく類似している)。この本では古いC++のソフトでプログラム記述されているので、それをPythonで改めて書こうというのが実はそもそものモチベーションであったが、気が付いたらかなりのボリュームになってしまった。
Python環境について
バージョン:3.12.3
$ pip install setuptools
$ pip install numpy
$ pip install scipy
$ pip install matplotlib
$ pip install japanize-matplotlib
単振り子
簡単な力学系の例として単振り子を紹介し、力学系の基本的な概念を導入する。

まず摩擦や空気抵抗を無視した場合、単振り子の微分方程式は次の通りである。ただし、
を対応させる。この写像をベクトル場という。
pythonプログラム
import numpy as np
import matplotlib.pyplot as plt
import japanize_matplotlib

gL = 1.0

theta_values = np.linspace(-2 * np.pi, 2 * np.pi, 20)
omega_values = np.linspace(-5, 5, 20)

theta, omega = np.meshgrid(theta_values, omega_values)

dtheta_dt = omega
domega_dt = -gL * np.sin(theta)

plt.figure(figsize=(10, 6))
plt.quiver(theta, omega, dtheta_dt, domega_dt, color="r")
plt.xlabel(r"$\theta$", fontsize=16)
plt.ylabel(r"$\omega$", fontsize=16)
plt.title("単振り子のベクトル場", fontsize=19)
plt.grid(True)
plt.show()

図を見易くするために、各ベクトルをすべて同じ長さにすることもある。
pythonプログラム
import numpy as np
import matplotlib.pyplot as plt
import japanize_matplotlib

gL = 1.0

theta_values = np.linspace(-2 * np.pi, 2 * np.pi, 20)
omega_values = np.linspace(-5, 5, 20)

theta, omega = np.meshgrid(theta_values, omega_values)

dtheta_dt = omega
domega_dt = -gL * np.sin(theta)

magnitude = np.sqrt(dtheta_dt**2 + domega_dt**2)
dtheta_dt_normalized = dtheta_dt / magnitude
domega_dt_normalized = domega_dt / magnitude

plt.figure(figsize=(10, 6))
plt.quiver(
    theta, omega, dtheta_dt_normalized, domega_dt_normalized, color="r", scale=40
)
plt.xlabel(r"$\theta$", fontsize=16)
plt.ylabel(r"$\omega$", fontsize=16)
plt.title("単振り子のベクトル場", fontsize=19)
plt.grid(True)
plt.show()

微分方程式の解曲線を、時間の向きも考慮して 軌道 (orbit) と呼ぶ。平面上に初期値をたくさん取って計算することで、流れ (flow) を描ける。これをPythonで描くと次の通りである。
pythonプログラム
import numpy as np
import matplotlib.pyplot as plt
import japanize_matplotlib
from scipy.integrate import solve_ivp


def pendulum(t, y):
    gL = 1.0
    theta, omega = y
    dydt = [omega, -gL * np.sin(theta)]
    return dydt


t_span = (0, 100)
t_eval = np.linspace(t_span[0], t_span[1], 1000)

# 初期値
np.random.seed(28)
num_initial_conditions = 200
initial_conditions_list = np.random.uniform(-5, 5, (num_initial_conditions, 2))


plt.figure(figsize=(10, 6))

for initial_conditions in initial_conditions_list:
    sol = solve_ivp(pendulum, t_span, initial_conditions, t_eval=t_eval)
    plt.plot(
        sol.y[0],
        sol.y[1],
    )

plt.grid(True)
plt.xlim(-5, 5)
plt.ylim(-5, 5)
plt.xlabel(r"$\theta$", fontsize=16)
plt.ylabel(r"$\omega$", fontsize=16)
plt.title("単振り子の流れ", fontsize=19)
plt.grid(True)
plt.show()

質点の速さ
pythonプログラム
import numpy as np
import matplotlib.pyplot as plt
import japanize_matplotlib

gL = 1.0
cm = 0.5

theta_values = np.linspace(-2 * np.pi, 2 * np.pi, 20)
omega_values = np.linspace(-5, 5, 20)

theta, omega = np.meshgrid(theta_values, omega_values)

dtheta_dt = omega
domega_dt = -gL * np.sin(theta) - cm * omega

magnitude = np.sqrt(dtheta_dt**2 + domega_dt**2)
dtheta_dt_normalized = dtheta_dt / magnitude
domega_dt_normalized = domega_dt / magnitude

plt.figure(figsize=(10, 6))
plt.quiver(
    theta, omega, dtheta_dt_normalized, domega_dt_normalized, color="r", scale=40
)
plt.xlabel(r"$\theta$", fontsize=16)
plt.ylabel(r"$\omega$", fontsize=16)
plt.title("単振り子のベクトル場(粘性抵抗)", fontsize=19)
plt.grid(True)
plt.show()
import numpy as np
import matplotlib.pyplot as plt
import japanize_matplotlib
from scipy.integrate import solve_ivp


def pendulum(t, y):
    gL = 1.0
    cm = 0.5
    theta, omega = y
    dydt = [omega, -gL * np.sin(theta) - cm * omega]
    return dydt


t_span = (0, 100)
t_eval = np.linspace(t_span[0], t_span[1], 1000)

# 初期値
np.random.seed(28)
num_initial_conditions = 100
initial_conditions_list = np.random.uniform(-4, 4, (num_initial_conditions, 2))


plt.figure(figsize=(10, 6))

for initial_conditions in initial_conditions_list:
    sol = solve_ivp(pendulum, t_span, initial_conditions, t_eval=t_eval)
    plt.plot(
        sol.y[0],
        sol.y[1],
    )

plt.grid(True)
plt.xlabel(r"$\theta$", fontsize=16)
plt.ylabel(r"$\omega$", fontsize=16)
plt.title("単振り子の流れ(粘性抵抗)", fontsize=19)
plt.grid(True)
plt.show()


次は振り子の台が
このとき、運動方程式から微分方程式は以下の通りである。
このように右辺に時間
を対応させる写像を考える。これを拡大相空間におけるベクトル場といい、同様に流れも定まる。
pythonプログラム
import numpy as np
import matplotlib.pyplot as plt
from scipy.integrate import solve_ivp


def pendulum(t, y):
    gL = 1.0
    cm = 0.3
    Omega = 1.0
    Bl = 1.1
    theta, omega = y
    dydt = [
        omega,
        -gL * np.sin(theta)
        - cm * omega
        + (Bl * Omega**2) * np.sin(Omega * t) * np.cos(theta),
    ]
    return dydt


t_span = (0, 200)
t_eval = np.linspace(t_span[0], t_span[1], 10000)

initial_conditions = [0.0, 0.0]

sol = solve_ivp(
    pendulum,
    t_span,
    initial_conditions,
    t_eval=t_eval,
)

fig = plt.figure(figsize=(12, 8))
ax = fig.add_subplot(111, projection="3d")

ax.plot(sol.t[:3000], sol.y[0][:3000], sol.y[1][:3000])

ax.set_xlabel("t", fontsize=16)
ax.set_ylabel(r"$\theta$", fontsize=16)
ax.set_zlabel(r"$\omega$", fontsize=16)
plt.show()

十分時間が経過したあとの軌道を
pythonプログラム
plt.figure(figsize=(10, 6))
plt.plot(sol.y[0][5000:], sol.y[1][5000:])
plt.xlabel(r"$\theta$", fontsize=16)
plt.ylabel(r"$\omega$", fontsize=16)
plt.title(r"$B/l = 1.1$", fontsize=19)
plt.grid(True)

plt.show()

pythonプログラム
import numpy as np
import matplotlib.pyplot as plt
from scipy.integrate import solve_ivp


def pendulum(t, y):
    gL = 1.0
    cm = 0.3
    Omega = 1.0
    Bl = 1.42
    theta, omega = y
    dydt = [
        omega,
        -gL * np.sin(theta)
        - cm * omega
        + (Bl * Omega**2) * np.sin(Omega * t) * np.cos(theta),
    ]
    return dydt


t_span = (0, 1000)
t_eval = np.linspace(t_span[0], t_span[1], 500000)

initial_conditions = [0.0, 0.0]

sol = solve_ivp(
    pendulum,
    t_span,
    initial_conditions,
    t_eval=t_eval,
)

plt.figure(figsize=(10, 6))
plt.plot(sol.y[0][-10000:], sol.y[1][-10000:])
plt.xlabel(r"$\theta$", fontsize=16)
plt.ylabel(r"$\omega$", fontsize=16)
plt.title(r"$B/l = 1.42$", fontsize=19)
plt.grid(True)

plt.show()

さらに
pythonプログラム
import numpy as np
import matplotlib.pyplot as plt
from scipy.integrate import solve_ivp


def pendulum(t, y):
    gL = 1.0
    cm = 0.3
    Omega = 1.0
    Bl = 1.443
    theta, omega = y
    dydt = [
        omega,
        -gL * np.sin(theta)
        - cm * omega
        + (Bl * Omega**2) * np.sin(Omega * t) * np.cos(theta),
    ]
    return dydt


t_span = (0, 1000)
t_eval = np.linspace(t_span[0], t_span[1], 500000)

initial_conditions = [0.0, 0.0]

sol = solve_ivp(
    pendulum,
    t_span,
    initial_conditions,
    t_eval=t_eval,
)

plt.figure(figsize=(10, 6))
plt.plot(sol.y[0][-40000:], sol.y[1][-40000:])
plt.xlabel(r"$\theta$", fontsize=16)
plt.ylabel(r"$\omega$", fontsize=16)
plt.title(r"$B/l = 1.443$", fontsize=19)
plt.grid(True)

plt.show()

このように、パラメータの変化にともない、システムが質的に変化することを分岐という。力学系では分岐の振る舞いを調べることが重要なテーマの1つである。
2. 線形ベクトル場
力学系では主に非線形力学系を対象とする。非線形力学系を解析するとき、線形力学系に近似することで線形代数の強力な恩恵を受けられることが多い。そこで、ここでは線形ベクトル場の性質について紹介する。
一般に線形ベクトル場は次のように定義される。
で定義される
1次元線形ベクトル場
1次元線形ベクトル場は、
で定義される。
である。定数
-
a>0 O -
a=0 -
a<0 O
見方を変えると、定数
各パターンにおけるPythonでの描画は以下の通りである。
pythonプログラム
import numpy as np
import matplotlib.pyplot as plt

t = np.linspace(-2, 2, 400)

initial_conditions = [
    0.5,
    1.0,
    1.5,
    2.0,
    0.0,
    -0.5,
    -1.0,
    -1.5,
    -2.0,
]

plt.figure(figsize=(6, 6))

for x0 in initial_conditions:
    x_t = x0 * np.exp(t)
    (line,) = plt.plot(t, x_t)
    color = line.get_color()
    for i in range(0, len(t) - 1, 50):
        plt.arrow(
            t[i],
            x_t[i],
            t[i + 1] - t[i],
            x_t[i + 1] - x_t[i],
            shape="full",
            lw=0,
            length_includes_head=True,
            head_width=0.1,
            color=color,
        )


plt.title(r"$x(t) = e^t x_0$", fontsize=19)
plt.xlabel("t", fontsize=16)
plt.ylabel("x", fontsize=16)
plt.grid(True)

plt.xlim(-2, 2)
plt.ylim(-2, 2)

plt.show()
import numpy as np
import matplotlib.pyplot as plt

t = np.linspace(-2, 2, 400)

initial_conditions = [
    0.5,
    1.0,
    1.5,
    0.0,
    -0.5,
    -1.0,
    -1.5,
]

plt.figure(figsize=(6, 6))

for x0 in initial_conditions:
    x_t = [x0 for _ in range(len(t))]
    (line,) = plt.plot(t, x_t)
    color = line.get_color()
    for i in range(0, len(t) - 1, 50):
        plt.arrow(
            t[i],
            x_t[i],
            t[i + 1] - t[i],
            x_t[i + 1] - x_t[i],
            shape="full",
            lw=0,
            length_includes_head=True,
            head_width=0.1,
            color=color,
        )


plt.title(r"$x(t) = x_0$", fontsize=19)
plt.xlabel("t", fontsize=16)
plt.ylabel("x", fontsize=16)
plt.grid(True)

plt.xlim(-2, 2)
plt.ylim(-2, 2)

plt.show()
import numpy as np
import matplotlib.pyplot as plt

t = np.linspace(-2, 2, 400)

initial_conditions = [
    0.5,
    1.0,
    1.5,
    2.0,
    0.0,
    -0.5,
    -1.0,
    -1.5,
    -2.0,
]

plt.figure(figsize=(6, 6))

for x0 in initial_conditions:
    x_t = x0 * np.exp(-t)
    (line,) = plt.plot(t, x_t)
    color = line.get_color()
    for i in range(0, len(t) - 1, 50):
        plt.arrow(
            t[i],
            x_t[i],
            t[i + 1] - t[i],
            x_t[i + 1] - x_t[i],
            shape="full",
            lw=0,
            length_includes_head=True,
            head_width=0.1,
            color=color,
        )


plt.title(r"$x(t) = e^{-t} x_0$", fontsize=19)
plt.xlabel("t", fontsize=16)
plt.ylabel("x", fontsize=16)
plt.grid(True)

plt.xlim(-2, 2)
plt.ylim(-2, 2)

plt.show()


2次元線形ベクトル場
2次元線形ベクトル場は
として次の式で定義される。
2次正方行列
- 固有方程式は相異なる2つの実根をもつ
- 固有方程式は1つの重根をもつ
- 固有方程式は複素共役な2つの虚根をもつ
相異なる2つの実根をもつ場合
固有方程式の相異なる2つの実根を
で表される。それぞれ1次元線形ベクトル場と同じなので、この場合の
固有値
pythonプログラム
import numpy as np
import matplotlib.pyplot as plt

t = np.linspace(0, 10, 400)

a = -1.0
b = -0.5

initial_conditions = [
    (0.5, 1.0),
    (1.0, 0.5),
    (1.5, 2.0),
    (-0.5, -1.0),
    (-1.0, -0.5),
    (-1.5, -2.0),
    (0.5, -1.0),
    (1.0, -0.5),
    (1.5, -2.0),
    (-0.5, 1.0),
    (-1.0, 0.5),
    (-1.5, 2.0),
    (0.0, 1.0),
    (0.0, -1.0),
    (1.0, 0.0),
    (-1.0, 0.0),
]
plt.figure(figsize=(6, 6))

for u0, v0 in initial_conditions:
    u_t = u0 * np.exp(a * t)
    v_t = v0 * np.exp(b * t)
    plt.plot(u_t, v_t, color="black")
    i = 20
    plt.arrow(
        u_t[i],
        v_t[i],
        u_t[i + 1] - u_t[i],
        v_t[i + 1] - v_t[i],
        shape="full",
        lw=0,
        length_includes_head=True,
        head_width=0.06,
        color="black",
    )

plt.title(r"$u(t) = e^{-t} u_0$ and $v(t) = e^{-0.5t} v_0$", fontsize=19)
plt.xlabel("u", fontsize=16)
plt.ylabel("v", fontsize=16)
plt.grid(True)

plt.xlim(-1, 1)
plt.ylim(-1, 1)

plt.show()
import numpy as np
import matplotlib.pyplot as plt

t = np.linspace(0, 10, 400)

a = -1.0
b = 0.5

initial_conditions = [
    (-1.0, 0.5),
    (1.0, 0.5),
    (-1.0, -0.5),
    (1.0, -0.5),
    (-1.0, 0.25),
    (1.0, 0.25),
    (-1.0, -0.25),
    (1.0, -0.25),
    (-1.0, 0.1),
    (1.0, 0.1),
    (-1.0, -0.1),
    (1.0, -0.1),
    (0.0, 0.01),
    (0.0, -0.01),
    (1.0, 0.0),
    (-1.0, 0.0),
]
plt.figure(figsize=(6, 6))

for u0, v0 in initial_conditions:
    u_t = u0 * np.exp(a * t)
    v_t = v0 * np.exp(b * t)
    plt.plot(u_t, v_t, color="black")
    if (u0, v0) == (1.0, 0.0) or (u0, v0) == (-1.0, 0.0):
        i = 40
    elif (u0, v0) == (0.0, 0.01) or (u0, v0) == (0.0, -0.01):
        i = 300
    else:
        i = 50
    plt.arrow(
        u_t[i],
        v_t[i],
        u_t[i + 1] - u_t[i],
        v_t[i + 1] - v_t[i],
        shape="full",
        lw=0,
        length_includes_head=True,
        head_width=0.06,
        color="black",
    )

plt.title(r"$u(t) = e^{-t} u_0$ and $v(t) = e^{0.5t} v_0$", fontsize=19)
plt.xlabel("u", fontsize=16)
plt.ylabel("v", fontsize=16)
plt.grid(True)

plt.xlim(-1, 1)
plt.ylim(-1, 1)

plt.show()


1つの重根をもつ場合
固有方程式の重根を
rankが0のとき
で表される。固有値
Pythonプログラム
import numpy as np
import matplotlib.pyplot as plt

t = np.linspace(0, 10, 400)

a = -1.0

initial_conditions = [
    (0.5, 1.0),
    (1.0, 0.5),
    (1.5, 2.0),
    (-0.5, -1.0),
    (-1.0, -0.5),
    (-1.5, -2.0),
    (0.5, -1.0),
    (1.0, -0.5),
    (1.5, -2.0),
    (-0.5, 1.0),
    (-1.0, 0.5),
    (-1.5, 2.0),
    (0.0, 1.0),
    (0.0, -1.0),
    (1.0, 0.0),
    (-1.0, 0.0),
]
plt.figure(figsize=(6, 6))

for u0, v0 in initial_conditions:
    u_t = u0 * np.exp(a * t)
    v_t = v0 * np.exp(a * t)
    plt.plot(u_t, v_t, color="black")
    i = 20
    plt.arrow(
        u_t[i],
        v_t[i],
        u_t[i + 1] - u_t[i],
        v_t[i + 1] - v_t[i],
        shape="full",
        lw=0,
        length_includes_head=True,
        head_width=0.06,
        color="black",
    )

plt.title(r"$u(t) = e^{-t} u_0$ and $v(t) = e^{-t} v_0$", fontsize=19)
plt.xlabel("u", fontsize=16)
plt.ylabel("v", fontsize=16)
plt.grid(True)

plt.xlim(-1, 1)
plt.ylim(-1, 1)

plt.show()

rankが1のとき
で表される。固有値
pythonプログラム
import numpy as np
import matplotlib.pyplot as plt

t = np.linspace(0, 10, 400)

a = -1.0

initial_conditions = [
    (0.5, 1.0),
    (1.0, 0.5),
    (1.5, 2.0),
    (-0.5, -1.0),
    (-1.0, -0.5),
    (-1.5, -2.0),
    (0.5, -1.0),
    (1.0, -0.5),
    (1.5, -2.0),
    (-0.5, 1.0),
    (-1.0, 0.5),
    (-1.5, 2.0),
    (0.0, 1.0),
    (0.0, -1.0),
    (1.0, 0.0),
    (-1.0, 0.0),
]
plt.figure(figsize=(6, 6))

for u0, v0 in initial_conditions:
    u_t = (np.array([u0 for _ in range(len(t))]) + t * v0) * np.exp(a * t)
    v_t = v0 * np.exp(a * t)
    plt.plot(u_t, v_t, color="black")
    i = 20
    plt.arrow(
        u_t[i],
        v_t[i],
        u_t[i + 1] - u_t[i],
        v_t[i + 1] - v_t[i],
        shape="full",
        lw=0,
        length_includes_head=True,
        head_width=0.06,
        color="black",
    )

plt.title(r"$u(t) = e^{-t} (u_0 + t v_0)$ and $v(t) = e^{-t} v_0$", fontsize=19)
plt.xlabel("u", fontsize=16)
plt.ylabel("v", fontsize=16)
plt.grid(True)

plt.xlim(-1, 1)
plt.ylim(-1, 1)

plt.show()

複素共役な2つの虚根をもつ場合
固有方程式の複素共役な2つの虚根を
このとき、
で表される。固有値
pythonプログラム
import numpy as np
import matplotlib.pyplot as plt
import japanize_matplotlib

t = np.linspace(0, 100, 4000)

a = -0.1
b = 1

initial_conditions = [
    (-1.0, 1.0),
]
plt.figure(figsize=(6, 6))

for u0, v0 in initial_conditions:
    u_t = (u0 * np.sin(b * t) + v0 * np.cos(b * t)) * np.exp(a * t)
    v_t = (u0 * np.cos(b * t) - v0 * np.sin(b * t)) * np.exp(a * t)
    plt.plot(u_t, v_t, color="black")
    ii = [150, 200, 300, 400, 500]
    for i in ii:
        plt.arrow(
            u_t[i],
            v_t[i],
            u_t[i + 1] - u_t[i],
            v_t[i + 1] - v_t[i],
            shape="full",
            lw=0,
            length_includes_head=True,
            head_width=0.06,
            color="black",
        )

plt.title(r"固有値$-0.1 \pm i$", fontsize=19)
plt.xlabel("u", fontsize=16)
plt.ylabel("v", fontsize=16)
plt.grid(True)

plt.xlim(-1, 1)
plt.ylim(-1, 1)

plt.show()
import numpy as np
import matplotlib.pyplot as plt
import japanize_matplotlib

t = np.linspace(0, 10, 400)

a = 0.0
b = 1

initial_conditions = [
    (0.1, 0.1),
    (0.2, 0.2),
    (0.4, 0.4),
    (0.6, 0.6),
    (0.8, 0.8),
]
plt.figure(figsize=(6, 6))

for u0, v0 in initial_conditions:
    u_t = (u0 * np.sin(b * t) + v0 * np.cos(b * t)) * np.exp(a * t)
    v_t = (u0 * np.cos(b * t) - v0 * np.sin(b * t)) * np.exp(a * t)
    plt.plot(u_t, v_t, color="black")
    i = 50
    plt.arrow(
        u_t[i],
        v_t[i],
        u_t[i + 1] - u_t[i],
        v_t[i + 1] - v_t[i],
        shape="full",
        lw=0,
        length_includes_head=True,
        head_width=0.06,
        color="black",
    )

plt.title(r"固有値$\pm i$", fontsize=19)
plt.xlabel("u", fontsize=16)
plt.ylabel("v", fontsize=16)
plt.grid(True)

plt.xlim(-1, 1)
plt.ylim(-1, 1)

plt.show()


3次元線形ベクトル場も同様に固有方程式の根を分類し、それぞれ標準化して連立微分方程式を解くと求まる。詳細は参考文献を参照のこと。
3. 離散時間力学系
連続時間力学系が微分方程式であったのに対して、離散時間力学系は差分方程式で記述される。点
で与えられる。これを単に写像という。
点
で与えられる点列
で与えられる点列
線形写像
線形ベクトル場と同様に線形写像を考える。その解析方法は線形ベクトル場と同じなので、ダイジェスト形式で紹介する。
で定義される
1次元線形写像
で定義される。
で表される。
pythonプログラム
import matplotlib.pyplot as plt
import numpy as np

t = np.arange(0, 20, 1)

a_values = [1.25, 0.8, -0.8, -1.25]
initial_values = [1, -1]

fig, axs = plt.subplots(2, 2, figsize=(12, 10))

for i, a in enumerate(a_values):
    ax = axs[i // 2, i % 2]

    if a in [1.25, 0.8]:
        for x_0 in initial_values:
            x_t = x_0 * (a**t)
            ax.plot(t, x_t, marker="o", label=f"x_0 = {x_0}, a = {a}")
            for j in range(len(t) - 1):
                ax.annotate(
                    "",
                    xy=(t[j + 1], x_t[j + 1]),
                    xytext=(t[j], x_t[j]),
                    arrowprops=dict(arrowstyle="->", color="black"),
                )
    else:
        x_0 = 1
        x_t = x_0 * (a**t)
        ax.plot(t, x_t, marker="o", label=f"x_0 = {x_0}, a = {a}")
        for j in range(len(t) - 1):
            ax.annotate(
                "",
                xy=(t[j + 1], x_t[j + 1]),
                xytext=(t[j], x_t[j]),
                arrowprops=dict(arrowstyle="->", color="black"),
            )

    ax.set_title(f"a = {a}", fontsize=19)
    ax.set_xlabel("t", fontsize=16)
    ax.set_ylabel("x(t)", fontsize=16)
    ax.grid(True)

plt.tight_layout()
plt.show()

2次元線形写像
2次元線形写像は
として次の式で定義される。
2次正方行列
- 固有方程式は相異なる2つの実根をもつ
- 固有方程式は1つの重根をもつ
- 固有方程式は複素共役な2つの虚根をもつ
相異なる2つの実根をもつ場合
固有値を
で表される。各固有値のパターンでのシミュレーション結果は次のようになる。
pythonプログラム
import matplotlib.pyplot as plt
import numpy as np

t = np.arange(0, 25, 1)

# a, bの値のリストとそれぞれの初期値のリスト
eigenvalues_and_initial_values = [
    (
        (0.8, 0.9),
        [
            (1, 1),
            (-1, 1),
            (1, -1),
            (-1, -1),
            (1, 0.5),
            (1, 0),
            (1, -0.5),
            (-1, 0.5),
            (-1, 0),
            (-1, -0.5),
        ],
    ),
    (
        (0.8, 1.25),
        [
            (-1, 0),
            (1, 0),
            (0, 0.01),
            (0, -0.01),
            (-1, 0.1),
            (-1, -0.1),
            (1, 0.1),
            (1, -0.1),
        ],
    ),
    ((-0.8, 1.25), [(1, 0.1), (-1, -0.1)]),
    ((-0.8, -1.25), [(0.5, -0.5), (-0.5, 0.5), (-0.3, -0.3), (0.3, 0.3)]),
]

fig, axs = plt.subplots(2, 2, figsize=(12, 10))

for i, ((a, b), initial_values) in enumerate(eigenvalues_and_initial_values):
    ax = axs[i // 2, i % 2]

    for x_0, y_0 in initial_values:
        x_t = x_0 * (a**t)
        y_t = y_0 * (b**t)

        ax.scatter(x_t, y_t, marker="o")
        for j in range(len(t) - 1):
            ax.annotate(
                "",
                xy=(x_t[j + 1], y_t[j + 1]),
                xytext=(x_t[j], y_t[j]),
                arrowprops=dict(arrowstyle="->", color="black"),
            )

    ax.set_title(f"a = {a}, b = {b}", fontsize=19)
    ax.set_xlabel("x(t)", fontsize=16)
    ax.set_ylabel("y(t)", fontsize=16)
    ax.set_xlim(-1, 1)
    ax.set_ylim(-1, 1)
    ax.grid(True)

plt.tight_layout()
plt.show()

1つの重根をもつ場合
重根を
階数が0のとき、
で表される。相空間での軌道は次のようになる。
pythonプログラム
import matplotlib.pyplot as plt
import numpy as np

t = np.arange(0, 25, 1)

# aの値とそれぞれの初期値のリスト
a_values_and_initial_values = [
    (
        -0.8,
        [
            (0.5, 1.0),
            (1.0, 0.5),
            (1.5, 2.0),
            (-0.5, -1.0),
            (-1.0, -0.5),
            (-1.5, -2.0),
            (0.5, -1.0),
            (1.0, -0.5),
            (1.5, -2.0),
            (-0.5, 1.0),
            (-1.0, 0.5),
            (-1.5, 2.0),
            (0.0, 1.0),
            (0.0, -1.0),
            (1.0, 0.0),
            (-1.0, 0.0),
        ],
    ),
    (
        0.8,
        [
            (0.5, 1.0),
            (1.0, 0.5),
            (1.5, 2.0),
            (-0.5, -1.0),
            (-1.0, -0.5),
            (-1.5, -2.0),
            (0.5, -1.0),
            (1.0, -0.5),
            (1.5, -2.0),
            (-0.5, 1.0),
            (-1.0, 0.5),
            (-1.5, 2.0),
            (0.0, 1.0),
            (0.0, -1.0),
            (1.0, 0.0),
            (-1.0, 0.0),
        ],
    ),
]

fig, axs = plt.subplots(1, 2, figsize=(12, 6))

for i, (a, initial_values) in enumerate(a_values_and_initial_values):
    ax = axs[i]

    for x_0, y_0 in initial_values:
        x_t = x_0 * (a**t)
        y_t = y_0 * (a**t)

        ax.scatter(x_t, y_t, marker="o")
        for j in range(len(t) - 1):
            if abs(x_t[j + 1]) <= 1 and abs(y_t[j + 1]) <= 1:
                ax.annotate(
                    "",
                    xy=(x_t[j + 1], y_t[j + 1]),
                    xytext=(x_t[j], y_t[j]),
                    arrowprops=dict(arrowstyle="->", color="black"),
                )

    ax.set_title(f"a = {a}", fontsize=19)
    ax.set_xlabel("x(t)", fontsize=16)
    ax.set_ylabel("y(t)", fontsize=16)
    ax.set_xlim(-1, 1)
    ax.set_ylim(-1, 1)
    ax.grid(True)

plt.tight_layout()
plt.show()

階数が1のとき、
で表される。相空間での軌道は次のようになる。
pythonプログラム
import matplotlib.pyplot as plt
import numpy as np

t = np.arange(0, 30, 1)

eigenvalues_and_initial_values = [
    (
        -1,
        [
            (1, 1),
            (-1, 1),
            (1, -1),
            (-1, -1),
            (1, 0.5),
            (1, 0),
            (1, -0.5),
            (-1, 0.5),
            (-1, 0),
            (-1, -0.5),
        ],
    ),
    (
        0.6,
        [
            (-1, 0),
            (1, 0),
            (-1, 1),
            (1, -1),
            (-1, 0.5),
            (1, -0.5),
        ],
    ),
    (
        1,
        [
            (-1, 0.8),
            (-1, 0.6),
            (-1, 0.3),
            (1, -0.8),
            (1, -0.6),
            (1, -0.3),
        ],
    ),
    (
        1.5,
        [
            (-0.01, 0),
            (0.01, 0),
            (-0.05, 0.01),
            (0.05, -0.01),
            (-0.15, 0.03),
            (0.15, -0.03),
        ],
    ),
]

fig, axs = plt.subplots(2, 2, figsize=(12, 10))

for i, (a, initial_values) in enumerate(eigenvalues_and_initial_values):
    ax = axs[i // 2, i % 2]

    for x_0, y_0 in initial_values:
        x_t = x_0 * (a ** t[1:]) + y_0 * t[1:] * (a ** (t[1:] - 1))
        x_t = np.insert(x_t, 0, x_0)
        y_t = y_0 * (a**t)
        if i == 0:
            ax.scatter(x_t, y_t, marker="o")
        else:
            ax.plot(x_t, y_t, marker="o")
        for j in range(len(t) - 1):
            ax.annotate(
                "",
                xy=(x_t[j + 1], y_t[j + 1]),
                xytext=(x_t[j], y_t[j]),
                arrowprops=dict(arrowstyle="->", color="black"),
            )

    ax.set_title(f"a = {a}", fontsize=19)
    ax.set_xlabel("x(t)", fontsize=16)
    ax.set_ylabel("y(t)", fontsize=16)
    ax.set_xlim(-1, 1)
    ax.set_ylim(-1, 1)
    ax.grid(True)

plt.tight_layout()
plt.show()

複素共役な2つの虚根をもつ場合
2つの複素共役な固有値を
によって定義すると、
で表される。
pythonプログラム
import matplotlib.pyplot as plt
import numpy as np

t = np.arange(0, 60, 1)

# r, θの値のリストとそれぞれの初期値のリスト
r_theta_and_initial_values = [
    ((0.95, np.pi / 10), [(1, 1), (-1, 1)]),
    ((1, np.pi / 10), [(0, 0.25), (0, 0.5), (0, 0.75)]),
    ((1.1, np.pi / 10), [(0.01, 0.01), (-0.01, 0.01)]),
]

fig, axs = plt.subplots(1, 3, figsize=(18, 6))

for i, ((r, theta), initial_values) in enumerate(r_theta_and_initial_values):
    ax = axs[i]

    for x_0, y_0 in initial_values:
        x_t = r**t * (x_0 * np.cos(theta * t) + y_0 * np.sin(theta * t))
        y_t = r**t * (-x_0 * np.sin(theta * t) + y_0 * np.cos(theta * t))

        ax.plot(x_t, y_t, marker="o", label=f"x_0 = {x_0}, y_0 = {y_0}")
        for j in range(len(t) - 1):
            if abs(x_t[j + 1]) <= 1 and abs(y_t[j + 1]) <= 1:
                ax.annotate(
                    "",
                    xy=(x_t[j + 1], y_t[j + 1]),
                    xytext=(x_t[j], y_t[j]),
                    arrowprops=dict(arrowstyle="->", color="black"),
                )

    ax.set_title(f"r = {r}, " + r"$\theta = \pi / 10$", fontsize=19)
    ax.set_xlabel("x(t)", fontsize=16)
    ax.set_ylabel("y(t)", fontsize=16)
    ax.set_xlim(-1, 1)
    ax.set_ylim(-1, 1)
    ax.grid(True)

plt.tight_layout()
plt.show()

4. ベクトル場の平衡点の分岐
単振り子の節で見たように、パラメータを変化させたときに力学系の振る舞いが質的に変化する現象を分岐現象という。パラメータ
を考える。パラメータ
を満たす点
平衡点から少しずれたときにどのような挙動をするかを調べることを安定性解析という。安定性にはいくつか定義があるが、今回は漸近安定性を紹介する。漸近安定性は、平衡点の近くにある点が時間とともに平衡点に収束することを意味する。
漸近安定性を判定するためには平衡点からの微小のずれ(変分)に注目すればよい。点
の運動を考える。
変分
1次近似すると、
という線形ベクトル場を得る。ここで、
とおいた。この
前の線形ベクトル場の説明で挙げた例では、固有値の実部がすべて負であるときは原点
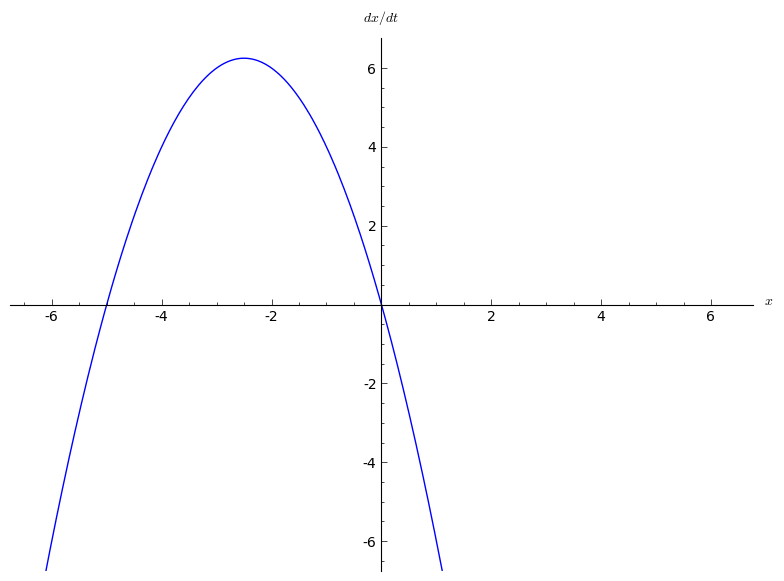
(例)実際に単振り子のベクトル場で安定性を調べてみよう。まずは、摩擦や空気抵抗を無視した場合を考える(
-
(\theta_0, \omega_0) = (0, \pi)
変分
となる。固有値は
-
(\theta_0, \omega_0) = (0, 0)
変分
となる。固有値は
次に速度に比例する空気抵抗の項を追加する(
平衡点はさきほどと同じである。
-
(\theta_0, \omega_0) = (0, 0)
変分
である。固有値は
ベクトル場の平衡点の分岐を調べるためには次の定理が重要である。
において平衡点 \mu = \mu_0 が双曲型であれば、パラメータ \vec{x}_0 の近傍で変化させるとき、平衡点は持続して、安定性の型は変化しない。 \mu = \mu_0
この定理から、ベクトル場の平衡点の分岐を考えるには、
1次元ベクトル場
サドル・ノード分岐
1次元ベクトル場
が
ならば、
で与えられる。マイナス符号の場合は次のような変化をする。
-
\mu < 0 -
\mu = 0 x = 0 0 -
\mu > 0 P^+ = \sqrt{\mu} P^- = -\sqrt{\mu} P^+ f_x(\sqrt{\mu}, \mu) = -2\sqrt{\mu} < 0 P^- f_x(-\sqrt{\mu}, \mu) = 2\sqrt{\mu}>0
グラフにすると次のようになる。
pythonプログラム
import matplotlib.pyplot as plt
import numpy as np

mus = np.array([-0.3, 0, 0.3])
x = np.arange(-1, 1, 0.01)

fig, axs = plt.subplots(1, 3, figsize=(18, 6))

for i, mu in enumerate(mus):
    ax = axs[i]
    xdot = mu - x * x
    ax.plot(x, xdot, linewidth=1.5, color="red")
    if i == 1:
        ax.scatter(0, 0, marker="o", s=150, color="black")
        ax.arrow(
            1.0,
            0,
            -0.7,
            0,
            head_width=0.08,
            head_length=0.05,
            fc="black",
            ec="black",
            linewidth=0.7,
        )
        ax.arrow(
            0,
            0,
            -0.3,
            0,
            head_width=0.08,
            head_length=0.05,
            fc="black",
            ec="black",
            linewidth=0.7,
        )
    elif i == 2:
        ax.scatter(np.sqrt(mu), 0, marker="o", s=150, color="black")
        ax.scatter(-np.sqrt(mu), 0, marker="o", s=150, color="blue")
        ax.arrow(
            -np.sqrt(mu),
            0,
            -0.3,
            0,
            head_width=0.08,
            head_length=0.05,
            fc="black",
            ec="black",
            linewidth=0.7,
        )
        ax.arrow(
            -np.sqrt(mu),
            0,
            0.8,
            0,
            head_width=0.08,
            head_length=0.05,
            fc="black",
            ec="black",
            linewidth=0.7,
        )
        ax.arrow(
            1,
            0,
            -0.2,
            0,
            head_width=0.08,
            head_length=0.05,
            fc="black",
            ec="black",
            linewidth=0.7,
        )
    ax.set_title(rf"$\mu = {mu}$", fontsize=19)
    ax.set_xlabel(r"$x(t)$", fontsize=16)
    ax.set_xlim(-1, 1)
    ax.set_ylim(-1, 1)
    ax.axhline(0, color="black", linewidth=0.7)
    ax.axvline(0, color="black", linewidth=0.7)
    ax.grid(True)

plt.tight_layout()
plt.show()


1次元ベクトル場で一般的に観測されるのはサドル・ノード分岐のみであることが知られている。ただし、拘束条件を付け加えると別の分岐が生じることがある。
トランスクリティカル分岐
トランスクリティカル分岐は原点に平衡点を持つという拘束条件を課したときに生じる分岐である。一般に1次元ベクトル場
が
ならば、
で与えられる。マイナス符号の場合は次のような変化をする。
-
\mu < 0 O \mu < 0 P = \mu -\mu > 0 -
\mu = 0 O 0 -
\mu > 0 O \mu > 0 P = \mu -\mu < 0
図示すると次のようになる。平衡点の安定性が正負で交代していることがわかる。
pythonプログラム
import matplotlib.pyplot as plt
import numpy as np

mus = np.array([-0.7, 0, 0.7])
x = np.arange(-1, 1, 0.01)

fig, axs = plt.subplots(1, 3, figsize=(18, 6))

for i, mu in enumerate(mus):
    ax = axs[i]
    xdot = x * (mu - x)
    ax.plot(x, xdot, linewidth=1.5, color="red")
    if i == 0:
        ax.scatter(0, 0, marker="o", s=150, color="black")
        ax.scatter(mu, 0, marker="o", s=150, color="blue")
        ax.arrow(
            mu,
            0,
            -0.2,
            0,
            head_width=0.08,
            head_length=0.05,
            fc="black",
            ec="black",
            linewidth=0.7,
        )
        ax.arrow(
            mu,
            0,
            0.3,
            0,
            head_width=0.08,
            head_length=0.05,
            fc="black",
            ec="black",
            linewidth=0.7,
        )
        ax.arrow(
            1,
            0,
            -0.55,
            0,
            head_width=0.08,
            head_length=0.05,
            fc="black",
            ec="black",
            linewidth=0.7,
        )
    elif i == 1:
        ax.scatter(0, 0, marker="o", s=150, color="blue")
        ax.arrow(
            1.0,
            0,
            -0.7,
            0,
            head_width=0.08,
            head_length=0.05,
            fc="black",
            ec="black",
            linewidth=0.7,
        )
        ax.arrow(
            0,
            0,
            -0.3,
            0,
            head_width=0.08,
            head_length=0.05,
            fc="black",
            ec="black",
            linewidth=0.7,
        )
    elif i == 2:
        ax.scatter(0, 0, marker="o", s=150, color="blue")
        ax.scatter(mu, 0, marker="o", s=150, color="black")
        ax.arrow(
            1,
            0,
            -0.1,
            0,
            head_width=0.08,
            head_length=0.05,
            fc="black",
            ec="black",
            linewidth=0.7,
        )
        ax.arrow(
            0,
            0,
            0.3,
            0,
            head_width=0.08,
            head_length=0.05,
            fc="black",
            ec="black",
            linewidth=0.7,
        )
        ax.arrow(
            0,
            0,
            -0.3,
            0,
            head_width=0.08,
            head_length=0.05,
            fc="black",
            ec="black",
            linewidth=0.7,
        )
    ax.set_title(rf"$\mu = {mu}$", fontsize=19)
    ax.set_xlabel(r"$x(t)$", fontsize=16)
    ax.set_xlim(-1, 1)
    ax.set_ylim(-1, 1)
    ax.axhline(0, color="black", linewidth=0.7)
    ax.axvline(0, color="black", linewidth=0.7)
    ax.grid(True)

plt.tight_layout()
plt.show()

以下のアニメーションはWikipediaから引用してきたものである。
ピッチフォーク分岐
ベクトル場
という拘束条件を課されたときにピッチフォーク分岐が生じる。一般に1次元ベクトル場
ならば、
で与えられる。マイナス符号のときの分岐の様子は次のようになる。
-
\mu < 0 O \mu < 0 -
\mu = 0 O 0 -
\mu > 0 O \mu > 0 P^{\pm} = \pm \sqrt{\mu} -2\mu
pythonプログラム
import matplotlib.pyplot as plt
import numpy as np

mus = np.array([-0.5, 0, 0.5])
x = np.arange(-1, 1, 0.01)

fig, axs = plt.subplots(1, 3, figsize=(18, 6))

for i, mu in enumerate(mus):
    ax = axs[i]
    xdot = x * (mu - x * x)
    ax.plot(x, xdot, linewidth=1.5, color="red")
    if i == 0 or i == 1:
        ax.scatter(0, 0, marker="o", s=150, color="black")
        ax.arrow(
            1.0,
            0,
            -0.7,
            0,
            head_width=0.08,
            head_length=0.05,
            fc="black",
            ec="black",
            linewidth=0.7,
        )
        ax.arrow(
            -1.0,
            0,
            0.7,
            0,
            head_width=0.08,
            head_length=0.05,
            fc="black",
            ec="black",
            linewidth=0.7,
        )
    elif i == 2:
        ax.scatter(0, 0, marker="o", s=150, color="blue")
        ax.scatter(np.sqrt(mu), 0, marker="o", s=150, color="black")
        ax.scatter(-np.sqrt(mu), 0, marker="o", s=150, color="black")
        ax.arrow(
            -1,
            0,
            0.1,
            0,
            head_width=0.08,
            head_length=0.05,
            fc="black",
            ec="black",
            linewidth=0.7,
        )
        ax.arrow(
            0,
            0,
            -0.5,
            0,
            head_width=0.08,
            head_length=0.05,
            fc="black",
            ec="black",
            linewidth=0.7,
        )
        ax.arrow(
            0,
            0,
            0.5,
            0,
            head_width=0.08,
            head_length=0.05,
            fc="black",
            ec="black",
            linewidth=0.7,
        )
        ax.arrow(
            1,
            0,
            -0.1,
            0,
            head_width=0.08,
            head_length=0.05,
            fc="black",
            ec="black",
            linewidth=0.7,
        )
    ax.set_title(rf"$\mu = {mu}$", fontsize=19)
    ax.set_xlabel(r"$x(t)$", fontsize=16)
    ax.set_xlim(-1, 1)
    ax.set_ylim(-1, 1)
    ax.axhline(0, color="black", linewidth=0.7)
    ax.axvline(0, color="black", linewidth=0.7)
    ax.grid(True)

plt.tight_layout()
plt.show()

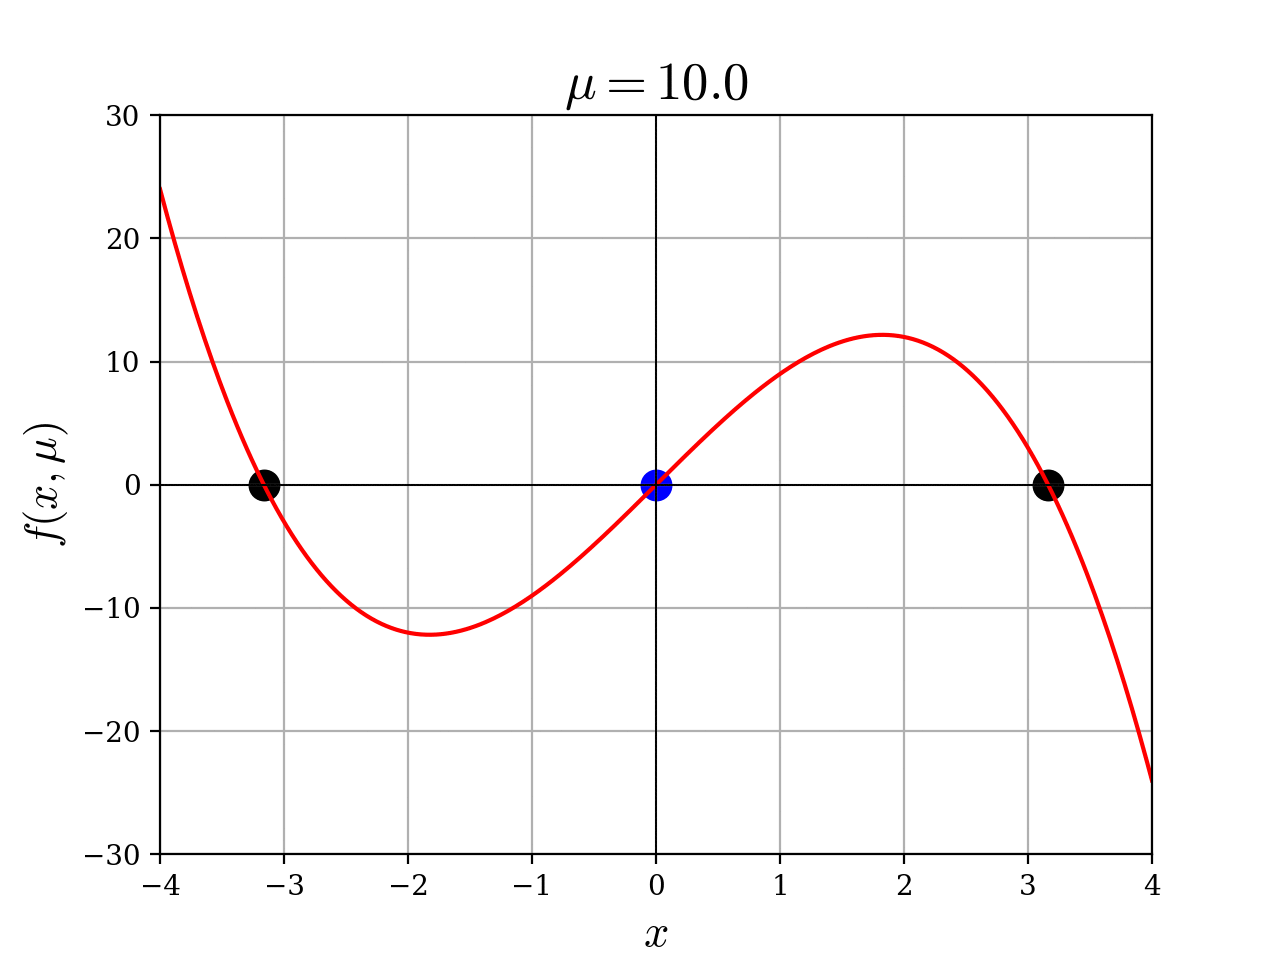
負から正にパラメータを動かすと、安定平衡点
pythonプログラム
import numpy as np
import matplotlib.pyplot as plt
from matplotlib.animation import FuncAnimation
from IPython.display import Image

plt.rcParams["figure.dpi"] = 200
plt.rcParams["font.family"] = "serif"
plt.rcParams["mathtext.fontset"] = "cm"


def f(x, mu):
    return x * (mu - x**2)


fig, ax = plt.subplots()
x = np.linspace(-4, 4, 400)
(line,) = ax.plot(x, f(x, -10), color="red", linewidth=1.5)

ax.grid(True)
ax.axhline(0, color="black", linewidth=0.7)
ax.axvline(0, color="black", linewidth=0.7)
ax.set_xlim(-4, 4)
ax.set_ylim(-30, 30)
ax.set_xlabel(r"$x$", fontsize=16)
ax.set_ylabel(r"$f(x, \mu)$", fontsize=16)
title = ax.set_title(r"$\mu = -10$", fontsize=19)

# 初期化
scatter_origin = ax.scatter(0, 0, marker="o", s=110, color="black")
scatter1 = ax.scatter([], [], marker="o", s=110, color="black")
scatter2 = ax.scatter([], [], marker="o", s=110, color="black")


def update(mu):
    line.set_ydata(f(x, mu))
    title.set_text(r"$\mu = {:.1f}$".format(mu))

    if mu >= 0:
        scatter_origin.set_color("blue")
    else:
        scatter_origin.set_color("black")

    if mu > 0:
        scatter1.set_offsets([[np.sqrt(mu), 0]])
        scatter2.set_offsets([[-np.sqrt(mu), 0]])
        scatter1.set_sizes([110])
        scatter2.set_sizes([110])
    else:
        scatter1.set_offsets([[0, 0]])
        scatter1.set_sizes([0])
        scatter2.set_offsets([[0, 0]])
        scatter2.set_sizes([0])

    return line, title, scatter_origin, scatter1, scatter2


ani = FuncAnimation(fig, update, frames=np.linspace(10, -5, 20), blit=True)
ani.save("./fig/function_animation.gif", writer="imagemagick")
plt.close(fig)

Image("./fig/function_animation.gif")
2次元ベクトル場
次に2次元ベクトル場の分岐を見ていく。
1次元と同様で、
が固有値の1つに0をもつ場合と、1組の複素共役固有値が純虚数になる場合の分岐を述べる。
サドル・ノード分岐
ヤコビ行列の固有値の1つに0を持つベクトル場
を考える。分岐の様子は次のようになる。
-
\mu < 0 -
\mu = 0 O 0, -1 -
\mu > 0 P^+ = (\sqrt{\mu}, 0) -2\sqrt{\mu}, -1 P^- = (-\sqrt{\mu}, 0) 2\sqrt{\mu}, -1
図示してみると、
pythonプログラム
import numpy as np
import matplotlib.pyplot as plt
from scipy.integrate import solve_ivp


def f(t, X, mu):
    x, y = X
    dydt = [mu - x**2, -y]
    return dydt


t_span = (0, 10)
t_eval = np.linspace(t_span[0], t_span[1], 1000)

initial_conditions_lists = [
    [
        [5, 0],
        [5, 3],
        [5, -3],
        [2, 5],
        [2, -5],
        [-1, 5],
        [-1, -5],
    ],
    [
        [5, 0],
        [-0.1, 0],
        [0, 5],
        [0, -5],
        [3, 5],
        [3, -5],
        [-1, 5],
        [-1, -5],
        [-0.5, 3],
        [-0.5, -3],
    ],
    [
        [5, 0],
        [-0.9, 0],
        [-1.1, 0],
        [0, 5],
        [0, -5],
        [1, 5],
        [1, -5],
        [3, 5],
        [3, -5],
        [-1, 5],
        [-1, -5],
        [-2, 5],
        [-2, -5],
        [-1.5, 4],
        [-1.5, -4],
    ],
]
mus = [-1, 0, 1]

fig, axs = plt.subplots(1, 3, figsize=(18, 6))

for i, mu in enumerate(mus):
    ax = axs[i]

    for initial_conditions in initial_conditions_lists[i]:
        sol = solve_ivp(f, t_span, initial_conditions, args=(mu,), t_eval=t_eval)
        ax.plot(sol.y[0], sol.y[1], color="black")

        idx = len(sol.t) // 3
        ax.annotate(
            "",
            xy=(sol.y[0][idx], sol.y[1][idx]),
            xytext=(sol.y[0][idx - 1], sol.y[1][idx - 1]),
            arrowprops=dict(arrowstyle="->", color="black", mutation_scale=20),
        )

    ax.grid(True)
    ax.set_xlim(-5, 5)
    ax.set_ylim(-5, 5)
    ax.set_xlabel(r"$x$", fontsize=16)
    ax.set_ylabel(r"$y$", fontsize=16)
    if i == 0:
        ax.set_title(r"$\mu < 0$", fontsize=19)
    elif i == 1:
        ax.scatter(0, 0, marker="o", s=150, color="black")
        ax.set_title(r"$\mu = 0$", fontsize=19)
    elif i == 2:
        ax.scatter(1, 0, marker="o", s=150, color="black")
        ax.scatter(-1, 0, marker="o", s=150, color="blue")
        ax.set_title(r"$\mu > 0$", fontsize=19)

plt.show()

ポアンカレ・アンドロノフ・ホップ分岐
ヤコビ行列の1組の複素共役固有値が純虚数になる場合を考える。2次元ベクトル場
を考える。極座標変換
となる。平衡点
-
\mu < 0 O \mu \pm i\omega -
\mu = 0 O \pm i\omega -
\mu > 0 O \mu \pm i\omega
このように、パラメータの変化により安定平衡点が不安定になり、その周囲に安定な周回軌道が生じるような分岐をポアンカレ・アンドロノフ・ホップ分岐という。
pythonプログラム
import numpy as np
import matplotlib.pyplot as plt
from scipy.integrate import solve_ivp


def f(t, X, mu):
    x, y = X
    omega = 5
    dydt = [
        mu * x - omega * y - x * (x**2 + y**2),
        mu * y + omega * x - y * (x**2 + y**2),
    ]
    return dydt


t_span = (0, 20)
t_eval = np.linspace(t_span[0], t_span[1], 2000)

initial_conditions_lists = [
    [
        [5, -5],
    ],
    [
        [5, -5],
    ],
    [
        [5, -5],
        [0, 0.1],
    ],
]
mus = [-0.5, 0, 10]

fig, axs = plt.subplots(1, 3, figsize=(18, 6))

for i, mu in enumerate(mus):
    ax = axs[i]

    for initial_conditions in initial_conditions_lists[i]:
        sol = solve_ivp(f, t_span, initial_conditions, args=(mu,), t_eval=t_eval)
        ax.plot(sol.y[0], sol.y[1], color="black")

        idx = 20
        ax.annotate(
            "",
            xy=(sol.y[0][idx], sol.y[1][idx]),
            xytext=(sol.y[0][idx - 1], sol.y[1][idx - 1]),
            arrowprops=dict(arrowstyle="->", color="black", mutation_scale=30),
        )

    ax.grid(True)
    ax.set_xlim(-5, 5)
    ax.set_ylim(-5, 5)
    ax.set_xlabel(r"$x$", fontsize=16)
    ax.set_ylabel(r"$y$", fontsize=16)
    if i == 0:
        ax.set_title(r"$\mu < 0$", fontsize=19)
    elif i == 1:
        ax.set_title(r"$\mu = 0$", fontsize=19)
    elif i == 2:
        ax.set_title(r"$\mu > 0$", fontsize=19)

plt.show()

5. 写像の周期点の分岐
パラメータ
を考える。
ベクトル場と同様に不動点
ヤコビ行列
写像
1次元写像の周期倍分岐
サドル・ノード分岐、トランスクリティカル分岐、ピッチフォーク分岐はベクトル場と同様に生じる。ここでは、周期倍分岐という2周期点が発生する分岐を説明する。
1次元写像
を考える。
-
\mu < 0 |\mu| \ll 1 O -1 - \mu |-1 - \mu| < 1 -
\mu = 0 O -1 -
\mu > 0 |\mu| \ll 1 O -1 - \mu |-1 - \mu| > 1 P^\pm = \pm \sqrt{\mu}
2周期点については、
であることからわかる。また、
なので2周期点は安定である。
pythonプログラム
import matplotlib.pyplot as plt
import numpy as np
import matplotlib.patches as patches

xs = np.linspace(-1, 1, 100)
mus = [-0.1, 0, 0.1]
init_xss = [[0.5], [0.5], [0.5]]

fig, axs = plt.subplots(1, 3, figsize=(18, 6))

for i, mu in enumerate(mus):
    ax = axs[i]
    fs = -xs - mu * xs + xs**3
    ax.plot(xs, fs, linewidth=1.5, color="red")
    ax.plot(xs, xs, color="black", linewidth=1.0)
    ax.plot(xs, -xs, color="black", linewidth=1.0)
    ax.axhline(0, color="black", linewidth=0.7)
    ax.axvline(0, color="black", linewidth=0.7)

    for init_x in init_xss[i]:
        x = init_x
        for _ in range(15):
            y = -x - mu * x + x**3
            ax.plot([x, x], [x, y], color="black")
            ax.plot([x, y], [y, y], color="black")
            arrow = patches.FancyArrowPatch(
                (x, x), (x, y), mutation_scale=15, color="black", arrowstyle="->"
            )
            ax.add_patch(arrow)
            arrow = patches.FancyArrowPatch(
                (x, y), (y, y), mutation_scale=15, color="black", arrowstyle="->"
            )
            ax.add_patch(arrow)
            x = y

    ax.set_xlim(-1, 1)
    ax.set_ylim(-1, 1)
    ax.set_title(rf"$\mu = {mu}$", fontsize=19)
    ax.set_xlabel(r"$x$", fontsize=16)
    ax.set_ylabel(r"$f(x,\mu)$", fontsize=16)
    ax.grid(True)

plt.tight_layout()
plt.show()

2次元写像
2次元写像
の分岐を考える。1次元と同様に
の固有値によって分岐が決まる。
ヤコビ行列が実固有値
-
\lambda_2 = 1 -
\lambda_2 = -1
現象としては1次元と変わらず図も煩雑なので、これらの図は省略する(参考文献に分岐イメージ図がある)。
ナイマルク・サッカー分岐
ヤコビ行列が絶対値1の複素共役固有値をもつ場合、ナイマルク・サッカー分岐が生じる。2次元写像に極座標変換を施したとき
で与えられる写像を考える。
であり、固有値は
となる。
-
\mu < 0 |\mu| \ll 1 (1 + d\mu)\exp(\pm(c_0 + c_1\mu)i) -
\mu = 0 \exp(\pm c_0 i) -
\mu > 0 |\mu| \ll 1 (1 + d\mu)\exp(\pm(c_0 + c_1\mu)i) r = \sqrt{-d\mu/a}
このように安定不動点がパラメータの変化に伴って不安定化し、その周囲に安定な不変円が発生する分岐をナイマルク・サッカー分岐という。
pythonプログラム
import matplotlib.pyplot as plt
import numpy as np


a = -0.1
b = 0.01
c0 = 0.2
c1 = 0
d = 1


def g(r, mu):
    return r + d * mu * r + a * r**3


rs = np.linspace(-4, 4, 1000)
mus = [-0.1, 0, 0.1]

fig, axs = plt.subplots(1, 3, figsize=(18, 6))

for i, mu in enumerate(mus):
    ax = axs[i]
    gs = g(rs, mu)

    ax.plot(rs, gs, linewidth=1.5, color="red")
    ax.plot(rs, rs, color="black", linewidth=1.0)
    ax.axhline(0, color="black", linewidth=0.7)
    ax.axvline(0, color="black", linewidth=0.7)

    ax.set_xlim(-4, 4)
    ax.set_ylim(-4, 4)
    ax.set_title(rf"$\mu = {mu}$, d > 0, a < 0", fontsize=19)
    ax.set_xlabel(r"$r$", fontsize=16)
    ax.set_ylabel(r"$g(r)$", fontsize=16)
    ax.grid(True)

plt.tight_layout()
plt.show()
import matplotlib.pyplot as plt
import numpy as np


a = -0.1
b = 0.01
c0 = 0.2
c1 = 0
d = 1


def g(r, mu):
    return r + d * mu * r + a * r**3


def h(r, theta, mu):
    return theta + c0 + c1 * mu + b * r**2


mus = [-0.1, 0, 0.1]

fig, axs = plt.subplots(1, 3, figsize=(18, 6))

for i, mu in enumerate(mus):
    ax = axs[i]

    r0 = 0.7
    theta0 = 0
    x0 = r0 * np.cos(theta0)
    y0 = r0 * np.sin(theta0)
    ax.scatter(x0, y0, marker="o", color="blue")

    for _ in range(100):
        r1 = g(r0, mu)
        theta1 = h(r0, theta0, mu)
        x1 = r1 * np.cos(theta1)
        y1 = r1 * np.sin(theta1)
        ax.scatter(x1, y1, marker="o", color="blue")
        ax.annotate(
            "",
            xy=(x1, y1),
            xytext=(x0, y0),
            arrowprops=dict(arrowstyle="->", color="black"),
        )
        x0 = x1
        y0 = y1
        r0 = r1
        theta0 = theta1

    ax.set_xlim(-1, 1)
    ax.set_ylim(-1, 1)
    ax.set_title(rf"$\mu = {mu}$, d > 0, a < 0", fontsize=19)
    ax.set_xlabel(r"$x$", fontsize=16)
    ax.set_ylabel(r"$y$", fontsize=16)
    ax.grid(True)

plt.tight_layout()
plt.show()


参考文献
- 小室元政『新版 基礎からの力学系 分岐解析からカオス的遍歴へ』
- 川上博『非線形現象入門』
- 大貫義郎、吉田春夫『岩波講座 現代の物理学 1 力学』
- 吉田善章、永長直人、石村直之、西成活裕『東京大学工学教程 非線形数学』
Discussion