😺
pprofのオプションを調べてみた
本家URL
インストール
go install github.com/google/pprof@latest
基本的な使い方
package main

import (
	"fmt"
	"os"
	"runtime/pprof"
)

func main() {
	f, err := os.Create("cpuprofile.pprof")
	if err != nil {
		panic(err)
	}

	if err := pprof.StartCPUProfile(f); err != nil {
		panic(err)
	}
	defer pprof.StopCPUProfile()

	for i := 0; i < 1000000; i++ {
		fmt.Println(i)
	}
}
- go toolから使用する場合
go tool pprof -http :8080 cpuprofile.pprof
- pprofから使う場合
pprof -http :8080 cpuprofile.pprof
出力フォーマットを指定する
pprof <format> [options] [binary] <source> ...
pprof -png  cpuprofile.pprof
Generating report in profile002.png
- gif, png等はそのままなので置いておいて
- それ以外普段触れなさそうな物をメモしておく
disasm
- 関数を指定するとアセンブラ形式でどこがボトルネックか表示されます
pprof -disasm="main.main" cpuprofile.pprof
Total: 520ms
ROUTINE ======================== _main.main
         0      520ms (flat, cum)   100% of Total
         .          .  1000a30a0: ldr   x16, [x28, #16]                     ;main.main
         .          .  1000a30a4: cmp   sp, x16
         .          .  1000a30a8: b.ls  0x1000a31bc <_main.main+0x11c>
         .          .  1000a30ac: str   x30, [sp, #-96]!
         .          .  1000a30b0: stur  x29, [sp, #-8]
         .          .  1000a30b4: sub   x29, sp, #8
         .          .  1000a30b8: str   xzr, [sp, #80]
         .          .  1000a30bc: strb  wzr, [sp, #55]
         .          .  1000a30c0: nop
         .          .  1000a30c4: adrp  x0, 0x1000a4000 <_main.main+0x28>
         .          .  1000a30c8: add   x0, x0, #3244
         .          .  1000a30cc: orr   x1, xzr, #0x10
         .          .  1000a30d0: mov   x2, #1538
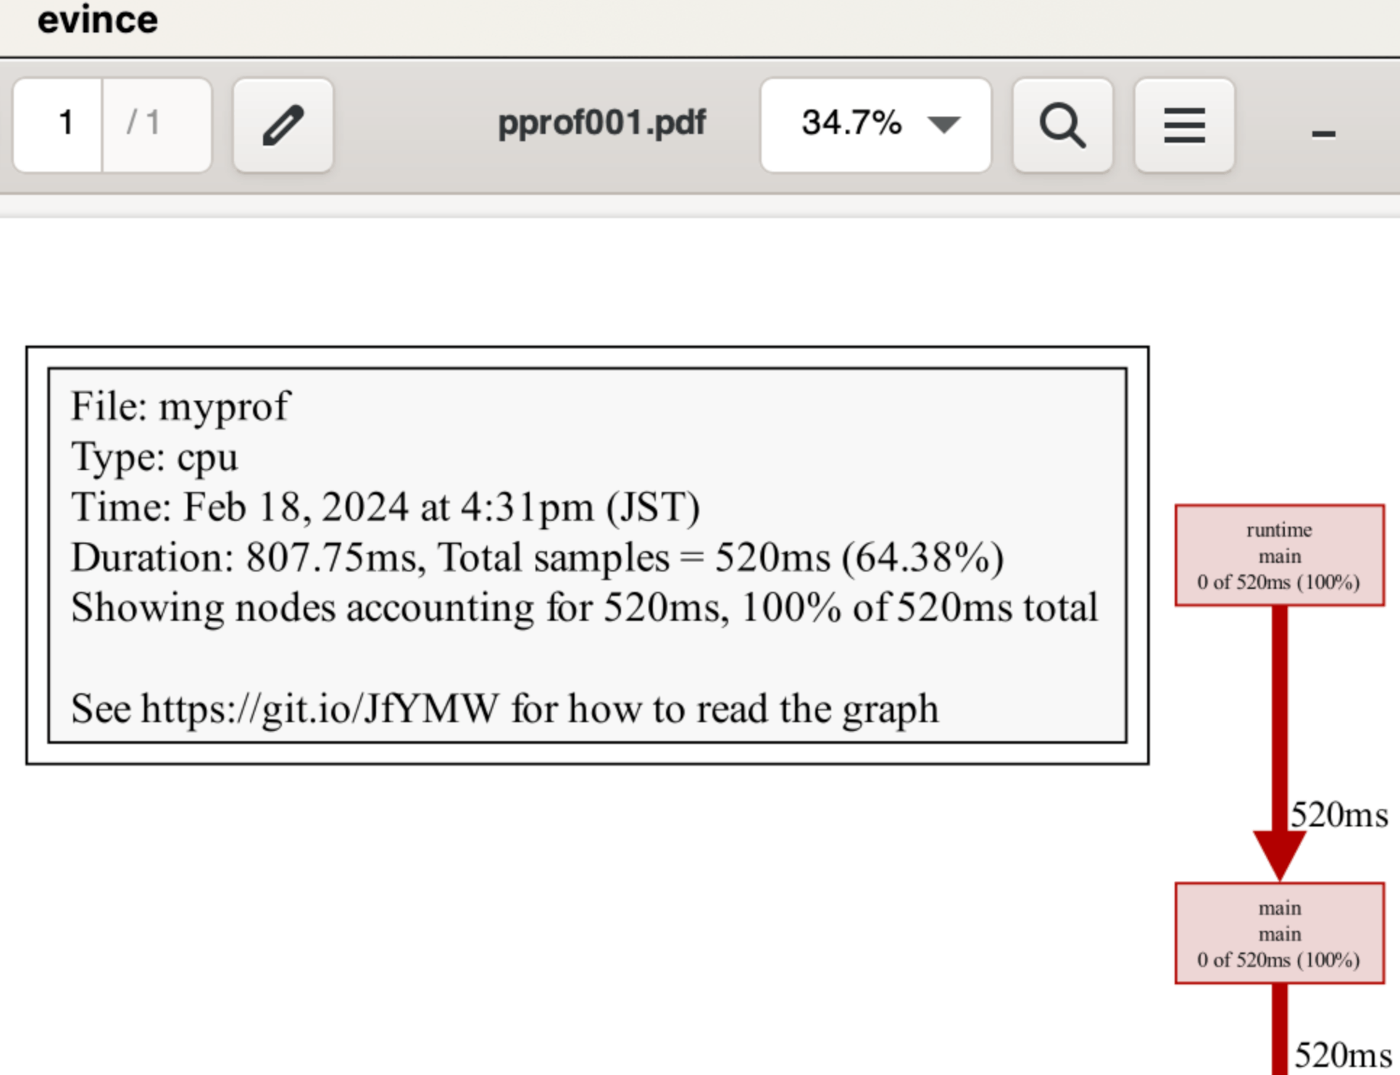
dot
- Graphvizで使用されているGraph記述言語
pprof -dot cpuprofile.pprof
digraph "myprof" {
node [style=filled fillcolor="#f8f8f8"]
subgraph cluster_L { "File: myprof" [shape=box fontsize=16 label="File: myprof\lType: cpu\lTime: Feb 18, 2024 at 4:31pm (JST)\lDuration: 807.75ms, Total samples = 520ms (64.38%)\lShowing nodes accounting for 520ms, 100% of 520ms total\l\lSee https://git.io/JfYMW for how to read the graph\l" tooltip="myprof"] }
N1 [label="syscall\nsyscall\n520ms (100%)" id="node1" fontsize=24 shape=box tooltip="syscall.syscall (520ms)" color="#b20000" fillcolor="#edd5d5"]
evince
- https://help.gnome.org/users/evince/stable/commandline.html.ja
- コマンドラインからドキュメントビューアーを起動する
brew install evince
pprof -evince cpuprofile.pprof
list
- .の部分に正規表現を書くとマッチしたところだけ出せる
pprof -list="." cpuprofile.pprof
ROUTINE ======================== syscall.write in /usr/local/go/src/syscall/zsyscall_darwin_arm64.go
         0      520ms (flat, cum)   100% of Total
         .          .   1702:func write(fd int, p []byte) (n int, err error) {
         .          .   1703:   var _p0 unsafe.Pointer
         .          .   1704:   if len(p) > 0 {
         .          .   1705:           _p0 = unsafe.Pointer(&p[0])
         .          .   1706:   } else {
         .          .   1707:           _p0 = unsafe.Pointer(&_zero)
         .          .   1708:   }
         .      520ms   1709:   r0, _, e1 := syscall(abi.FuncPCABI0(libc_write_trampoline), uintptr(fd), uintptr(_p0), uintptr(len(p)))
         .          .   1710:   n = int(r0)
         .          .   1711:   if e1 != 0 {
         .          .   1712:           err = errnoErr(e1)
         .          .   1713:   }
         .          .   1714:   return
引数の例
- ROUTINEに出ているsyscall等をいれる
pprof -list="syscall" cpuprofile.pprof
Total: 520ms
ROUTINE ======================== syscall.Write in /usr/local/go/src/syscall/syscall_unix.go
         0      520ms (flat, cum)   100% of Total
         .          .    199:func Write(fd int, p []byte) (n int, err error) {
         .          .    200:   if race.Enabled {
         .          .    201:           race.ReleaseMerge(unsafe.Pointer(&ioSync))
         .          .    202:   }
         .          .    203:   if faketime && (fd == 1 || fd == 2) {
         .          .    204:           n = faketimeWrite(fd, p)
         .          .    205:           if n < 0 {
         .          .    206:                   n, err = 0, errnoErr(Errno(-n))
         .          .    207:           }
         .          .    208:   } else {
         .      520ms    209:           n, err = write(fd, p)
         .          .    210:   }
         .          .    211:   if race.Enabled && n > 0 {
         .          .    212:           race.ReadRange(unsafe.Pointer(&p[0]), n)
         .          .    213:   }
         .          .    214:   if msanenabled && n > 0 {
ROUTINE ======================== syscall.syscall in /usr/local/go/src/runtime/sys_darwin.go
     520ms      520ms (flat, cum)   100% of Total
         .          .     21:func syscall_syscall(fn, a1, a2, a3 uintptr) (r1, r2, err uintptr) {
         .          .     22:   args := struct{ fn, a1, a2, a3, r1, r2, err uintptr }{fn, a1, a2, a3, r1, r2, err}
         .          .     23:   entersyscall()
     520ms      520ms     24:   libcCall(unsafe.Pointer(abi.FuncPCABI0(syscall)), unsafe.Pointer(&args))
         .          .     25:   exitsyscall()
         .          .     26:   return args.r1, args.r2, args.err
         .          .     27:}
         .          .     28:func syscall()
         .          .     29:
ROUTINE ======================== syscall.write in /usr/local/go/src/syscall/zsyscall_darwin_arm64.go
         0      520ms (flat, cum)   100% of Total
         .          .   1702:func write(fd int, p []byte) (n int, err error) {
         .          .   1703:   var _p0 unsafe.Pointer
         .          .   1704:   if len(p) > 0 {
         .          .   1705:           _p0 = unsafe.Pointer(&p[0])
         .          .   1706:   } else {
         .          .   1707:           _p0 = unsafe.Pointer(&_zero)
         .          .   1708:   }
         .      520ms   1709:   r0, _, e1 := syscall(abi.FuncPCABI0(libc_write_trampoline), uintptr(fd), uintptr(_p0), uintptr(len(p)))
         .          .   1710:   n = int(r0)
         .          .   1711:   if e1 != 0 {
         .          .   1712:           err = errnoErr(e1)
         .          .   1713:   }
         .          .   1714:   return
peek
- 正規表現に一致する関数の呼び出し元/呼び出し先を出力する
pprof -peek="main.main" cpuprofile.pprof
File: myprof
Type: cpu
Time: Feb 18, 2024 at 4:31pm (JST)
Duration: 807.75ms, Total samples = 520ms (64.38%)
Showing nodes accounting for 520ms, 100% of 520ms total
----------------------------------------------------------+-------------
      flat  flat%   sum%        cum   cum%   calls calls% + context
----------------------------------------------------------+-------------
                                             520ms   100% |   runtime.main
         0     0%     0%      520ms   100%                | main.main
                                             520ms   100% |   fmt.Println (inline)
----------------------------------------------------------+-------------
raw
- 生のプロファイルのテキスト表現を出力
pprof -raw cpuprofile.pprof
PeriodType: cpu nanoseconds
Period: 10000000
Time: 2024-02-18 16:31:56.704618 +0900 JST
Duration: 807.
Samples:
samples/count cpu/nanoseconds
         52  520000000: 1 2 3 4 5 6 7
Locations
     1: 0x1027e9ba7 M=1 syscall.syscall /usr/local/go/src/runtime/sys_darwin.go:24:0 s=21
     2: 0x102804427 M=1 syscall.write /usr/local/go/src/syscall/zsyscall_darwin_arm64.go:1709:0 s=1702
     3: 0x1028109bf M=1 syscall.Write /usr/local/go/src/syscall/syscall_unix.go:209:0 s=199
             internal/poll.ignoringEINTRIO /usr/local/go/src/internal/poll/fd_unix.go:736:0 s=734
             internal/poll.(*FD).Write /usr/local/go/src/internal/poll/fd_unix.go:380:0 s=366
     4: 0x10281133b M=1 os.(*File).write /usr/local/go/src/os/file_posix.go:46:0 s=45
             os.(*File).Write /usr/local/go/src/os/file.go:189:0 s=185
     5: 0x102815723 M=1 fmt.Fprintln /usr/local/go/src/fmt/print.go:305:0 s=302
     6: 0x10282b163 M=1 fmt.Println /usr/local/go/src/fmt/print.go:314:0 s=313
             main.main /Users/hoge/tmp/202402/myprof/main.go:24:0 s=9
     7: 0x1027bd22b M=1 runtime.main /usr/local/go/src/runtime/proc.go:271:0 s=146
Mappings
1: 0x102788000/0x102854000/0x0 /Users/hoge/tmp/202402/myprof/myprof  [FN]
traces
- テキスト形式ですべてのプロファイルサンプルを出力
pprof -traces cpuprofile.pprof
File: myprof
Type: cpu
Time: Feb 18, 2024 at 4:31pm (JST)
Duration: 807.75ms, Total samples = 520ms (64.38%)
-----------+-------------------------------------------------------
     520ms   syscall.syscall
             syscall.write
             syscall.Write (inline)
             internal/poll.ignoringEINTRIO (inline)
             internal/poll.(*FD).Write
             os.(*File).write (inline)
             os.(*File).Write
             fmt.Fprintln
             fmt.Println (inline)
             main.main
             runtime.main
-----------+-------------------------------------------------------
tree
- callgraphをテキスト形式で出力
pprof -tree cpuprofile.pprof
File: myprof
Type: cpu
Time: Feb 18, 2024 at 4:31pm (JST)
Duration: 807.75ms, Total samples = 520ms (64.38%)
Showing nodes accounting for 520ms, 100% of 520ms total
----------------------------------------------------------+-------------
      flat  flat%   sum%        cum   cum%   calls calls% + context
----------------------------------------------------------+-------------
                                             520ms   100% |   syscall.write
     520ms   100%   100%      520ms   100%                | syscall.syscall
----------------------------------------------------------+-------------
                                             520ms   100% |   fmt.Println
         0     0%   100%      520ms   100%                | fmt.Fprintln
                                             520ms   100% |   os.(*File).Write
----------------------------------------------------------+-------------
                                             520ms   100% |   main.main (inline)
         0     0%   100%      520ms   100%                | fmt.Println
                                             520ms   100% |   fmt.Fprintln
----------------------------------------------------------+-------------
                                             520ms   100% |   os.(*File).write
         0     0%   100%      520ms   100%                | internal/poll.(*FD).Write
                                             520ms   100% |   internal/poll.ignoringEINTRIO (inline)
----------------------------------------------------------+-------------
                                             520ms   100% |   internal/poll.(*FD).Write (inline)
         0     0%   100%      520ms   100%                | internal/poll.ignoringEINTRIO
                                             520ms   100% |   syscall.Write (inline)
----------------------------------------------------------+-------------
                                             520ms   100% |   runtime.main
         0     0%   100%      520ms   100%                | main.main
                                             520ms   100% |   fmt.Println (inline)
----------------------------------------------------------+-------------
                                             520ms   100% |   fmt.Fprintln
         0     0%   100%      520ms   100%                | os.(*File).Write
                                             520ms   100% |   os.(*File).write (inline)
----------------------------------------------------------+-------------
                                             520ms   100% |   os.(*File).Write (inline)
         0     0%   100%      520ms   100%                | os.(*File).write
                                             520ms   100% |   internal/poll.(*FD).Write
----------------------------------------------------------+-------------
         0     0%   100%      520ms   100%                | runtime.main
                                             520ms   100% |   main.main
----------------------------------------------------------+-------------
                                             520ms   100% |   internal/poll.ignoringEINTRIO (inline)
         0     0%   100%      520ms   100%                | syscall.Write
                                             520ms   100% |   syscall.write
----------------------------------------------------------+-------------
                                             520ms   100% |   syscall.Write
         0     0%   100%      520ms   100%                | syscall.write
                                             520ms   100% |   syscall.syscall
----------------------------------------------------------+-------------
オプション
オプションの確認
pprof cpuprofile.pprof
- oを入力するとオプションの状態が確認出来る
(pprof) o
  call_tree                 = false
  compact_labels            = true
  divide_by                 = 1
  drop_negative             = false
  edgefraction              = 0.001
  focus                     = ""
  granularity               = functions            //: [addresses | filefunctions | files | functions | lines]
  hide                      = ""
  ignore                    = ""
  intel_syntax              = false
  mean                      = false
  nodecount                 = -1                   //: default
  nodefraction              = 0.005
  noinlines                 = false
  normalize                 = false
  output                    = ""
  prune_from                = ""
  relative_percentages      = false
  sample_index              = cpu                  //: [samples | cpu]
  show                      = ""
  show_from                 = ""
  showcolumns               = false
  sort                      = flat                 //: [cum | flat]
  tagfocus                  = ""
  taghide                   = ""
  tagignore                 = ""
  tagleaf                   = ""
  tagroot                   = ""
  tagshow                   = ""
  trim                      = true
  trim_path                 = ""
  unit                      = minimum
call_tree
- true,falseで設定
- 同じ関数でも異なるパスで呼ばれた場合に違う物として扱う
(pprof) help call_tree
Create a context-sensitive call tree
Treat locations reached through different paths as separate.
compact_labels
- true, falseで設定
- web, list等を呼ばれた時に適用する
- 小さすぎると適用がされないように見える
(pprof) help compact_labels
Show minimal headers
divide_by
- 数値を割り当てる
- プロセッサ数などを割り当てて分かりやすい数値にする為
(pprof) help divide_by
Ratio to divide all samples before visualization
Divide all samples values by a constant, eg the number of processors or jobs.
drop_negative
- true, falseで設定
- 0未満の値を切り捨てる
(pprof) help drop_negative
Ignore negative differences
Do not show any locations with values <0.
edgefraction
- 0.001 等が割り当てられる
- 全体のサンプル数に対する割合(
<f>)に基づいて、特定の閾値以下の関数間の呼び出し関係を示す線を表示から隠すために使用される
(pprof) help edgefraction
Hide edges below <f>*total
focus
- 正規表現をいれる
- matchする関数などに表示を制限する
(pprof) help focus
Restricts to samples going through a node matching regexp
Discard samples that do not include a node matching this regexp.
Matching includes the function name, filename or object name.
granularity
- 解説が無かった
(pprof) help granularity
Unknown command: granularity
hide
- 正規表現を入れる
- 隠したい関数名を表示から隠してくれる
(pprof) help hide
Skips nodes matching regexp
Discard nodes that match this location.
Other nodes from samples that include this location will be shown.
Matching includes the function name, filename or object name.
例
(pprof) hide=runtime.main
(pprof) list .
ignore
- 世紀表現がはいる
- 特定の条件に一致するノードを除外
(pprof) help ignore
Skips paths going through any nodes matching regexp
If set, discard samples that include a node matching this regexp.
Matching includes the function name, filename or object name.
intel_syntax
- true,false
- アセンブリをIntel構文で表示する
(pprof) help intel_syntax
Show assembly in Intel syntax
Only applicable to commands `disasm` and `weblist`
mean
- true,false
- サンプルの平均値が表示されるようになる
(pprof) help mean
Average sample value over first value (count)
For memory profiles, report average memory per allocation.
For time-based profiles, report average time per event.
nodecount
- -1で多分制限無し
- 表示ノード数の制限
(pprof) help nodecount
Max number of nodes to show
Uses heuristics to limit the number of locations to be displayed.
On graphs, dotted edges represent paths through nodes that have been removed.
nodefraction
- 0.001など
- 特定の値以下のノードを隠す
(pprof) help nodefraction
Hide nodes below <f>*total
noinlines
- true,false
- inlineを無視するかどうか
(pprof) help noinlines
Ignore inlines.
Attributes inlined functions to their first out-of-line caller.
normalize
- true,false
- プロファイルを別のプロファイルに合わせてスケールする
(pprof) help normalize
Scales profile based on the base profile.
output
- 文字列
- 出力する先のファイル名
(pprof) help output
Output filename for file-based outputs
prune_from
- 正規表現
- マッチしたフレームより下のフレームをドロップする
(pprof) help prune_from
Drops any functions below the matched frame.
If set, any frames matching the specified regexp and any frames
below it will be dropped from each sample.
relative_percentages
- true,false
- サブグラフの相対的なパーセンテージを表示
(pprof) help relative_percentages
Show percentages relative to focused subgraph
If unset, percentages are relative to full graph before focusing
to facilitate comparison with original graph.
sample_index
- cpuか0,1など
- 報告すべきIndexを指定する
(pprof) help sample_index
Sample value to report (0-based index or name)
Profiles contain multiple values per sample.
Use sample_index=i to select the ith value (starting at 0).
Or use sample_index=name, with name in [samples cpu].
show
- 正規表現
- 正規表現にMatchするノードだけを表示する
(pprof) help show
Only show nodes matching regexp
If set, only show nodes that match this location.
Matching includes the function name, filename or object name.
show_from
- 正規表現
- マッチした正規表現より上にあるノードを削除
(pprof) help show_from
Drops functions above the highest matched frame.
If set, all frames above the highest match are dropped from every sample.
Matching includes the function name, filename or object name.
showcolumns
- true,false
- ソースコードに行レベルで番号を出力するかどうか
(pprof) help showcolumns
Show column numbers at the source code line level.
tagfocus
- 正規表現
- 特定のタグなどをフィルタリングする
(pprof) help tagfocus
Restricts to samples with tags in range or matched by regexp
Use name=value syntax to limit the matching to a specific tag.
Numeric tag filter examples: 1kb, 1kb:10kb, memory=32mb:
String tag filter examples: foo, foo.*bar, mytag=foo.*bar
taghide
- 正規表現
- マッチしたタグをスキップする
(pprof) help taghide
Skip tags matching this regexp
Discard tags that match this regexp
tagignore
- 正規表現
- マッチするタグを無視
(pprof) help tagignore
Discard samples with tags in range or matched by regexp
Use name=value syntax to limit the matching to a specific tag.
Numeric tag filter examples: 1kb, 1kb:10kb, memory=32mb:
String tag filter examples: foo, foo.*bar, mytag=foo.*bar
tagleaf
- key
- コールスタックのリーフ(末端)にラベルのキー/値ペアに基づく疑似スタックフレームを追加するために使う
(pprof) help tagleaf
Adds pseudo stack frames for labels key/value pairs at the callstack leaf.
A comma-separated list of label keys.
The last key creates frames at the new leaf.
続く
Discussion