Open5
Polkadotノードのメトリックを取得してみる
Polkadotノードは起動している前提。
2021-12-23 10:55:30 〽️ Prometheus exporter started at 127.0.0.1:9615
Prometheusの設定ファイル作っておく。
prometheus.yml
scrape_configs:
  - job_name: 'substrate_node'
    scrape_interval: 5s
    static_configs:
      - targets: ['localhost:9615']
PrometheusはHomebrewでインストールして起動。
$ brew install prometheus
$ prometheus --config.file=./prometheus.yml
ts=2021-12-23T15:13:12.379Z caller=main.go:478 level=info msg="No time or size retention was set so using the default time retention" duration=15d
ts=2021-12-23T15:13:12.379Z caller=main.go:515 level=info msg="Starting Prometheus" version="(version=2.32.1, branch=HEAD, revision=41f1a8125e664985dd30674e5bdf6b683eff5d32)"
ts=2021-12-23T15:13:12.379Z caller=main.go:520 level=info build_context="(go=go1.17.5, user=root@a2a62523c036, date=20211217-21:54:28)"
ts=2021-12-23T15:13:12.379Z caller=main.go:521 level=info host_details="(Linux 5.10.47-linuxkit #1 SMP PREEMPT Sat Jul 3 21:50:16 UTC 2021 aarch64 6909b357c38f (none))"
ts=2021-12-23T15:13:12.379Z caller=main.go:522 level=info fd_limits="(soft=1048576, hard=1048576)"
ts=2021-12-23T15:13:12.379Z caller=main.go:523 level=info vm_limits="(soft=unlimited, hard=unlimited)"
ts=2021-12-23T15:13:12.380Z caller=web.go:570 level=info component=web msg="Start listening for connections" address=0.0.0.0:9090
ts=2021-12-23T15:13:12.386Z caller=main.go:924 level=info msg="Starting TSDB ..."
ts=2021-12-23T15:13:12.438Z caller=tls_config.go:195 level=info component=web msg="TLS is disabled." http2=false
ts=2021-12-23T15:13:12.462Z caller=head.go:488 level=info component=tsdb msg="Replaying on-disk memory mappable chunks if any"
ts=2021-12-23T15:13:12.478Z caller=head.go:522 level=info component=tsdb msg="On-disk memory mappable chunks replay completed" duration=10.417µs
ts=2021-12-23T15:13:12.478Z caller=head.go:528 level=info component=tsdb msg="Replaying WAL, this may take a while"
ts=2021-12-23T15:13:12.479Z caller=head.go:599 level=info component=tsdb msg="WAL segment loaded" segment=0 maxSegment=0
ts=2021-12-23T15:13:12.479Z caller=head.go:605 level=info component=tsdb msg="WAL replay completed" checkpoint_replay_duration=68.541µs wal_replay_duration=159.458µs total_replay_duration=279.75µs
ts=2021-12-23T15:13:12.479Z caller=main.go:945 level=info fs_type=EXT4_SUPER_MAGIC
ts=2021-12-23T15:13:12.480Z caller=main.go:948 level=info msg="TSDB started"
ts=2021-12-23T15:13:12.480Z caller=main.go:1129 level=info msg="Loading configuration file" filename=/etc/prometheus/prometheus.yml
ts=2021-12-23T15:13:12.519Z caller=main.go:1166 level=info msg="Completed loading of configuration file" filename=/etc/prometheus/prometheus.yml totalDuration=39.602333ms db_storage=3.75µs remote_storage=4.083µs web_handler=1.417µs query_engine=3.709µs scrape=496.666µs scrape_sd=64.334µs notify=3.334µs notify_sd=2µs rules=4.042µs
ts=2021-12-23T15:13:12.519Z caller=main.go:897 level=info msg="Server is ready to receive web requests."
localhost:9615/metrics にアクセスするとブワーっとメトリックデータが返ってくる。
$ curl localhost:9615/metrics
# HELP substrate_block_height Block height info of the chain
# TYPE substrate_block_height gauge
substrate_block_height{status="best",chain="ksmcc3"} 1787835
substrate_block_height{status="finalized",chain="ksmcc3"} 1786881
substrate_block_height{status="sync_target",chain="ksmcc3"} 10647071
# HELP substrate_block_verification_and_import_time Time taken to verify and import blocks
# TYPE substrate_block_verification_and_import_time histogram
substrate_block_verification_and_import_time_bucket{chain="ksmcc3",le="0.005"} 975045
substrate_block_verification_and_import_time_bucket{chain="ksmcc3",le="0.01"} 1764393
substrate_block_verification_and_import_time_bucket{chain="ksmcc3",le="0.025"} 1782572
    :
続いてGrafana起動。
Prometheusと同じようにHomebrewでインストールして起動
$ brew install grafana
$ brew services start grafana
http://localhost:3000/ でGrafanaにアクセスできる。
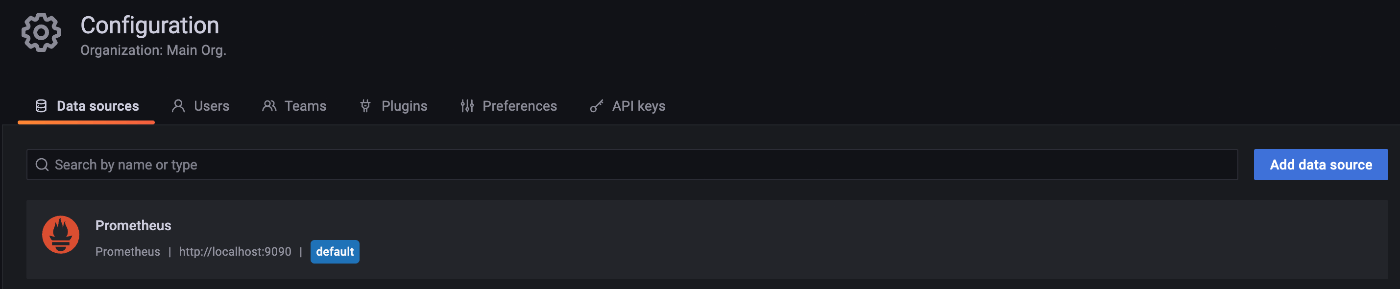
Grafanaの設定。
Configuration -> Data sources からPrometheusを指定する。

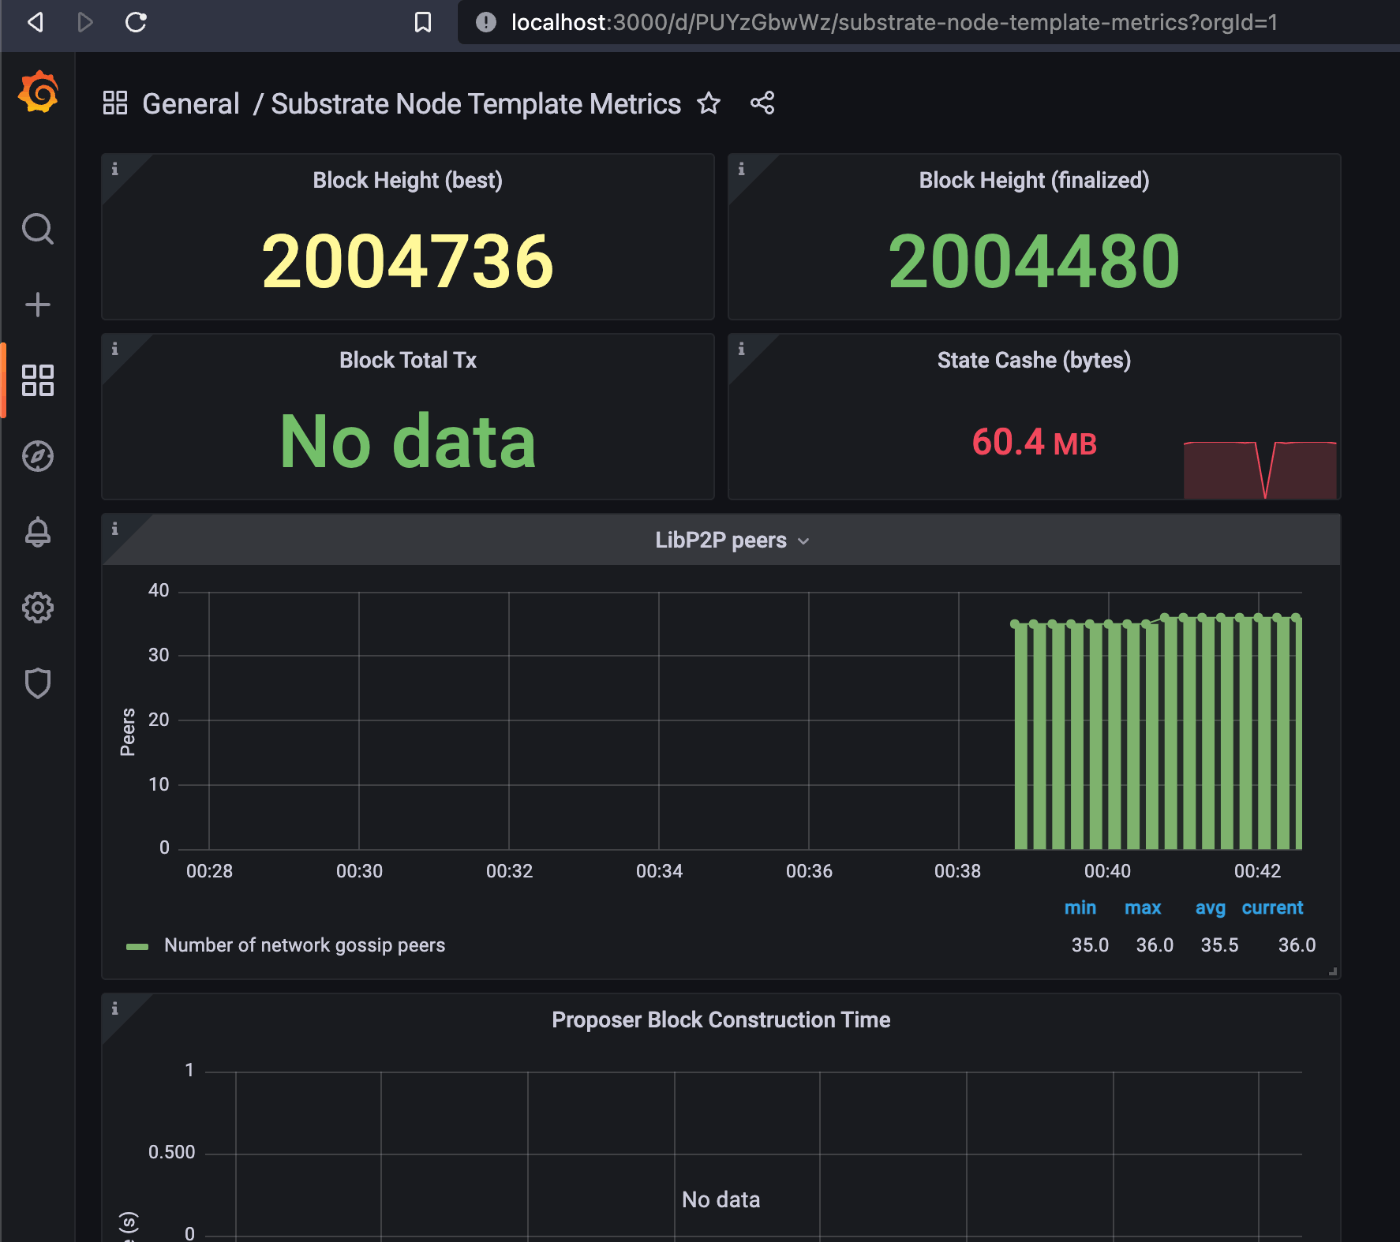
で、ダッシュボード表示用の設定をsubstrateのテンプレート読み込んで設定してみる。
テンプレ: https://docs.substrate.io/assets/tutorials/node-metrics/substrate-node-template-metrics.json
Create -> Import から substrate-node-template-metrics.json を貼り付けて保存して読み込ませる。
こんな感じで見れると。