執筆日
2025/2/19
Data Formulatorとは?
Data Formulatorは、Microsoft Researchが開発したOSSのAI駆動型データ可視化ツールです。GUIと自然言語入力を組み合わせており、ユーザーは簡単にデータの可視化が行えます。
使い方
- 以下のコマンドを実行する
# data_formulatorをinstallする
pip install data_formulator
# 立ち上げる
data_formulator
#デフォルトのポートが占有されている場合は、python -m data_formulator --port 8080 でポート番号 (8080 など) を指定できます。
-
http://localhost:5000/ で以下が立ち上がることを確認

-
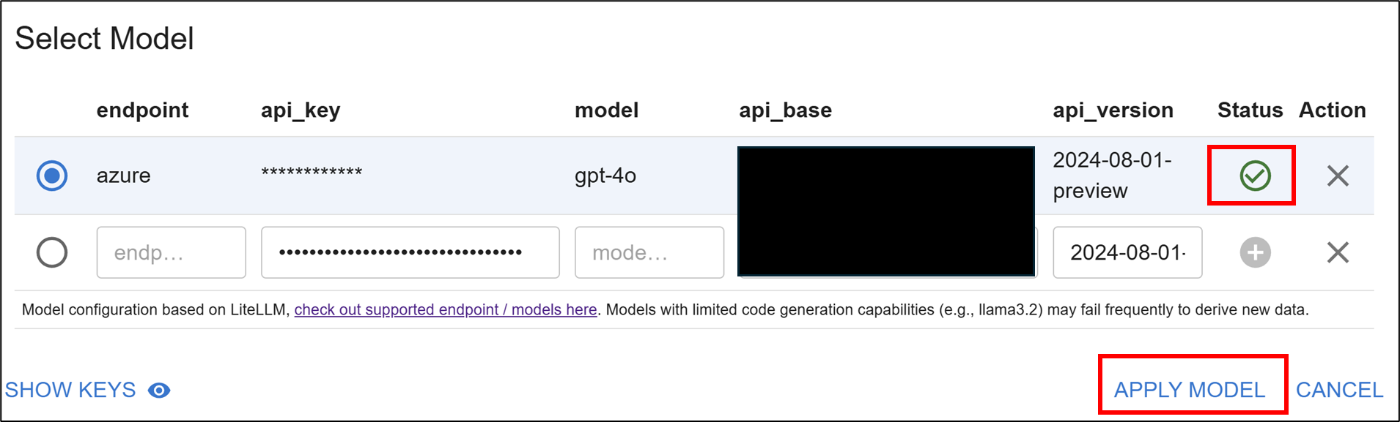
SELECT A MODELをクリック

-
以下を入力しStatusを更新する。その後、APPLY MODELをクリック
・endpoint:azure
・api_key:AOAIのキー
・model:好きなモデル
・api_base:AOAIのエンドポイント
・api_version:APIバージョン(今回は、2024-08-01-preview を入力しました)
-
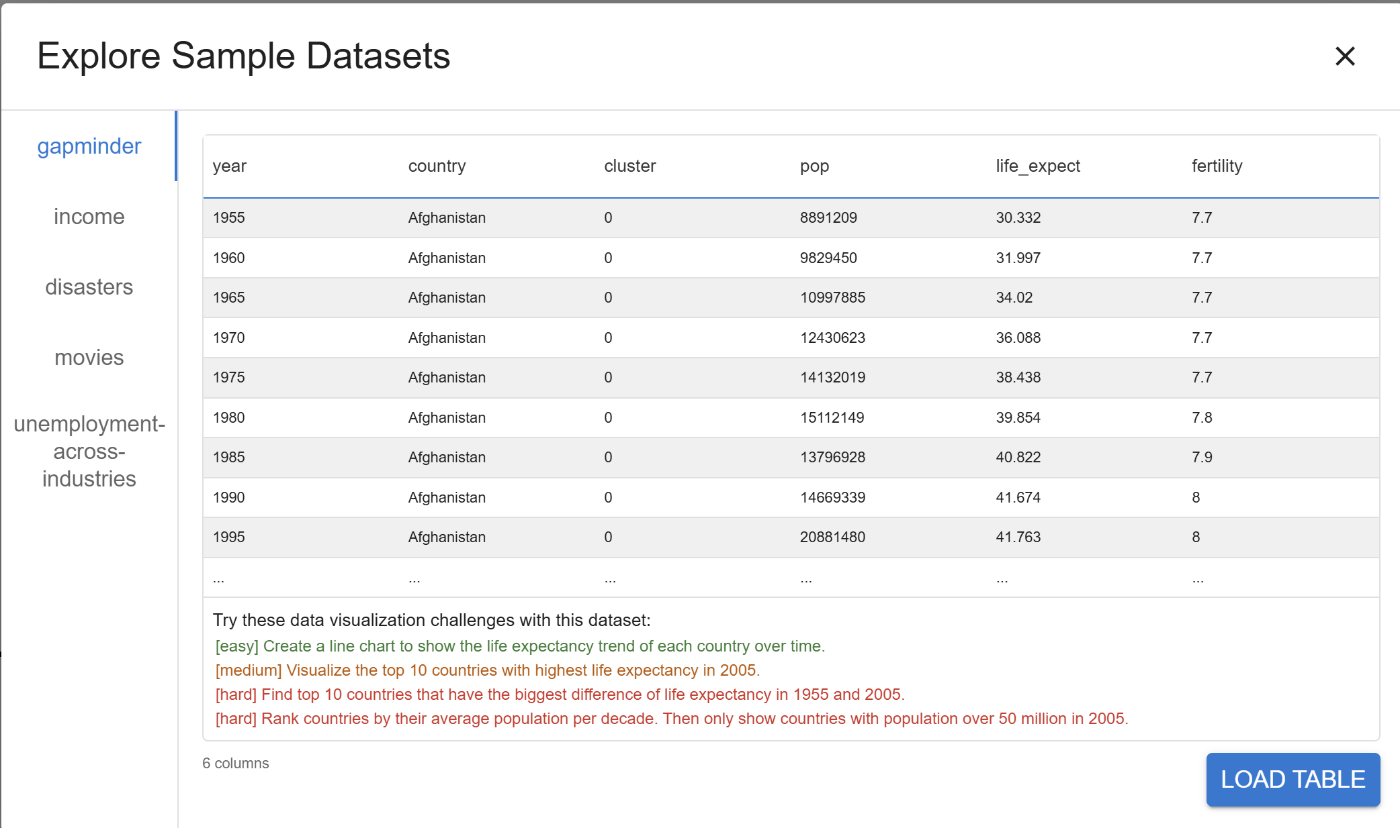
Explore Sample Datasetsからgapminderを選択する
-
以下のように表示されることを確認する

-
Line Chartをクリック

-
以下のように図を作成できる

-
Autoをクリック
-
以下のプロンプトを投げてみる
棒グラフを作成してください。その際のx軸はyear,y軸はlife_expectです。
x軸のyearは5年周期でまとめてください。y軸のlife_expectは、5年周期の平均値にしてください。
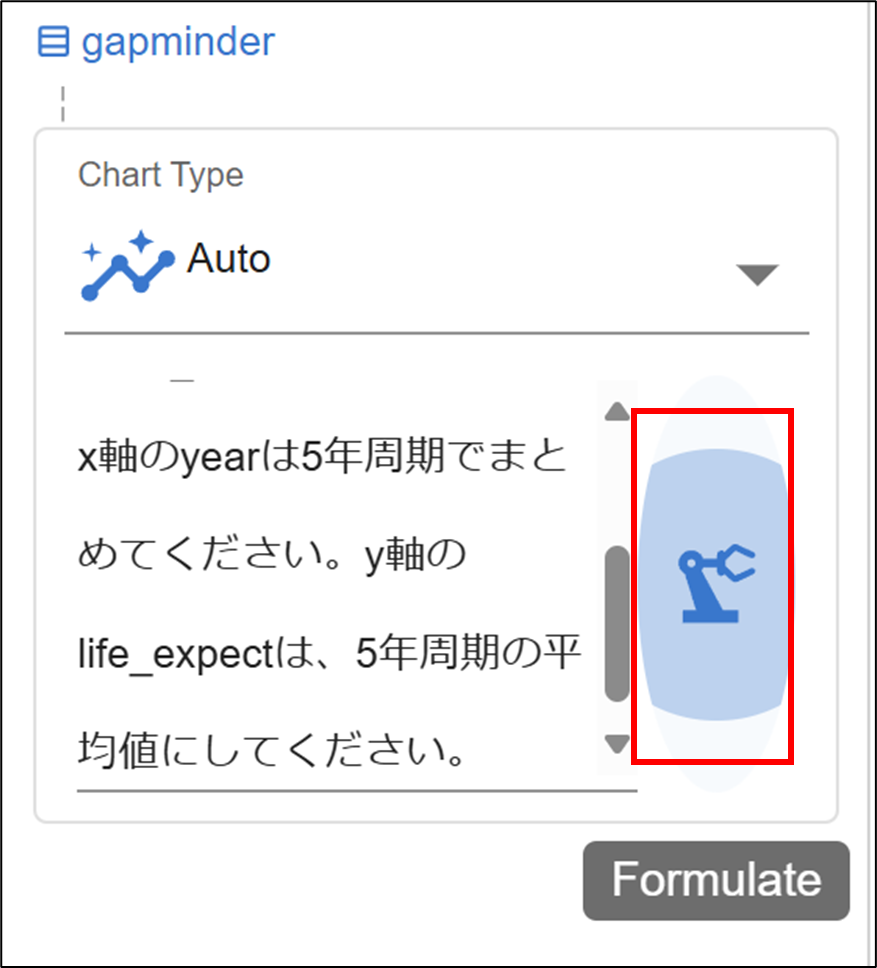
おー作成されている

コンソールのログをみると、エージェントの仕組みが組み込まれている。
プロンプトを投げる(GOALを設定)→プロンプトをJson形式に変換→5年周期のlife_expecrの平均を求めるコードを生成→平均値算出→可視化用のコード生成→可視化
ログから一部抜粋。
[GOAL]
棒グラフを作成してください。その際のx軸はyear,y軸はlife_expectです。
x軸のyearは5年周期でまとめてください。y軸のlife_expectは、5年周期の平均値にしてください。
=== Data recommendation result ===>
2025-02-18 22:17:00,614 - data_formulator.agents.agent_data_rec - INFO - ```json
{
"mode": "infer",
"recommendation": "The user wants to create a bar chart to visualize the average life expectancy for 5-year periods.",
"output_fields": ["year_period", "avg_life_expect"],
"chart_type": "bar",
"visualization_fields": ["year_period", "avg_life_expect"]
}
```python
import pandas as pd
import collections
import numpy as np

def transform_data(df):
    df['year_period'] = (df['year'] // 5) * 5
    transformed_df = df.groupby('year_period', as_index=False).agg(avg_life_expect=('life_expect', 'mean'))
    return transformed_df
Here are our datasets, here are their field summaries and samples:
table_0 (table_95) fields:
avg_life_expect -- type: float64, values: 57.6457453968, 59.6241326984, 61.6504146032, 63.4488552381, 65.2148152381, 66.9224126984, 68.4744920635, 69.3488095238, 70.6650952381, 71.7374444444, 72.8782539683
year_period -- type: int64, values: 1955, 1960, 1965, 1970, 1975, 1980, 1985, 1990, 1995, 2000, 2005
table_0 (table_95) sample:
|avg_life_expect|year_period
0|57.6457453968|1955
1|59.6241326984|1960
2|61.6504146032|1965
3|63.4488552381|1970
4|65.2148152381|1975
......
utils.py:1120 - Wrapper: Completed Call, calling success_handler
{
"fields": {
"avg_life_expect": {"type": "number", "semantic_type": "Number", "sort_order": null},
"year_period": {"type": "number", "semantic_type": "Year", "sort_order": null}
{
"fields": {
"avg_life_expect": {"type": "number", "semantic_type": "Number", "sort_order": null},
"year_period": {"type": "number", "semantic_type": "Year", "sort_order": null}
},
"data summary": "The dataset contains information about average life expectancy over different years, specifically from 1955 to 2005 in five-year intervals."
}
-
可視化した図のExportも可能

-
データは、Local,URLからもImport可能です。


Discussion