やること
AutoGenを触ってみる。
データの可視化をしてみる
前提
- AOAIを構築済みであること
参考記事
code
- 以下のコードを実行する
from autogen import AssistantAgent, UserProxyAgent

config_list = [{'model': '<model名>', 'api_key': <apiキー>','api_type' : 'azure', 'base_url' : '<endpoint>' , 'api_version' :'<api-version>' }]

from autogen import AssistantAgent, UserProxyAgent, config_list_from_json

code_execution_config = {
    "work_dir": "coding",
    "use_docker": False
}

assistant = AssistantAgent("assistant", llm_config={"config_list": config_list})
user_proxy = UserProxyAgent("user_proxy", code_execution_config=code_execution_config)

message = "Plot a chart of Microsoft stock price change YTD."
user_proxy.initiate_chat(assistant, message=message)
2. 以下が出力される
user_proxy (to assistant):

Plot a chart of Microsoft stock price change YTD.

--------------------------------------------------------------------------------
assistant (to user_proxy):

To plot a chart of Microsoft stock price change Year-to-Date (YTD), we need to first collect the necessary data. We can retrieve historical stock price data for Microsoft from a financial data provider like Yahoo Finance.

Here is a Python code that utilizes the `yfinance` library to fetch the stock price data and plot it using `matplotlib`:

```python
# filename: msft_stock_chart.py
import yfinance as yf
import matplotlib.pyplot as plt

# Fetch the historical stock data for Microsoft
msft = yf.Ticker("MSFT")
history = msft.history(period="YTD")

# Extract the closing prices and dates
closing_prices = history['Close']
dates = closing_prices.index

# Plot the chart
plt.plot(dates, closing_prices)
plt.xlabel('Date')
plt.ylabel('Stock Price (USD)')
plt.title('Microsoft Stock Price Change YTD')
plt.xticks(rotation=45)
plt.grid(True)

# Display the chart
plt.show()
- 実行すると、エラーが出る
 import yfinance as yf
ModuleNotFoundError: No module named 'yfinance'
- 以下のコードを実行し、installする
pip install yfinance
- 再度コードを実行すると、株価を確認できた。

- 2024年度のデータしかないので、創業期から今に至るまでのデータを可視化するように聞いてみる
I would like to plot the stock price from the time of inception to March 2024.
- 以下のコードが返ってくる
--------------------------------------------------------------------------------
Provide feedback to assistant. Press enter to skip and use auto-reply, or type 'exit' to end the conversation: I would like to plot the stock price from the time of inception to March 2024.
user_proxy (to assistant):
I would like to plot the stock price from the time of inception to March 2024.
--------------------------------------------------------------------------------
assistant (to user_proxy):
To plot the stock price for Microsoft from its inception to March 2024, we can modify the code I provided earlier to fetch historical data for a longer period of time.
Here's the updated Python code:
```python
# filename: msft_stock_chart.py
import yfinance as yf
import matplotlib.pyplot as plt
# Fetch the historical stock data for Microsoft
msft = yf.Ticker("MSFT")
history = msft.history(start="1986-03-13", end="2024-03-31")
# Extract the closing prices and dates
closing_prices = history['Close']
dates = closing_prices.index
# Plot the chart
plt.plot(dates, closing_prices)
plt.xlabel('Date')
plt.ylabel('Stock Price (USD)')
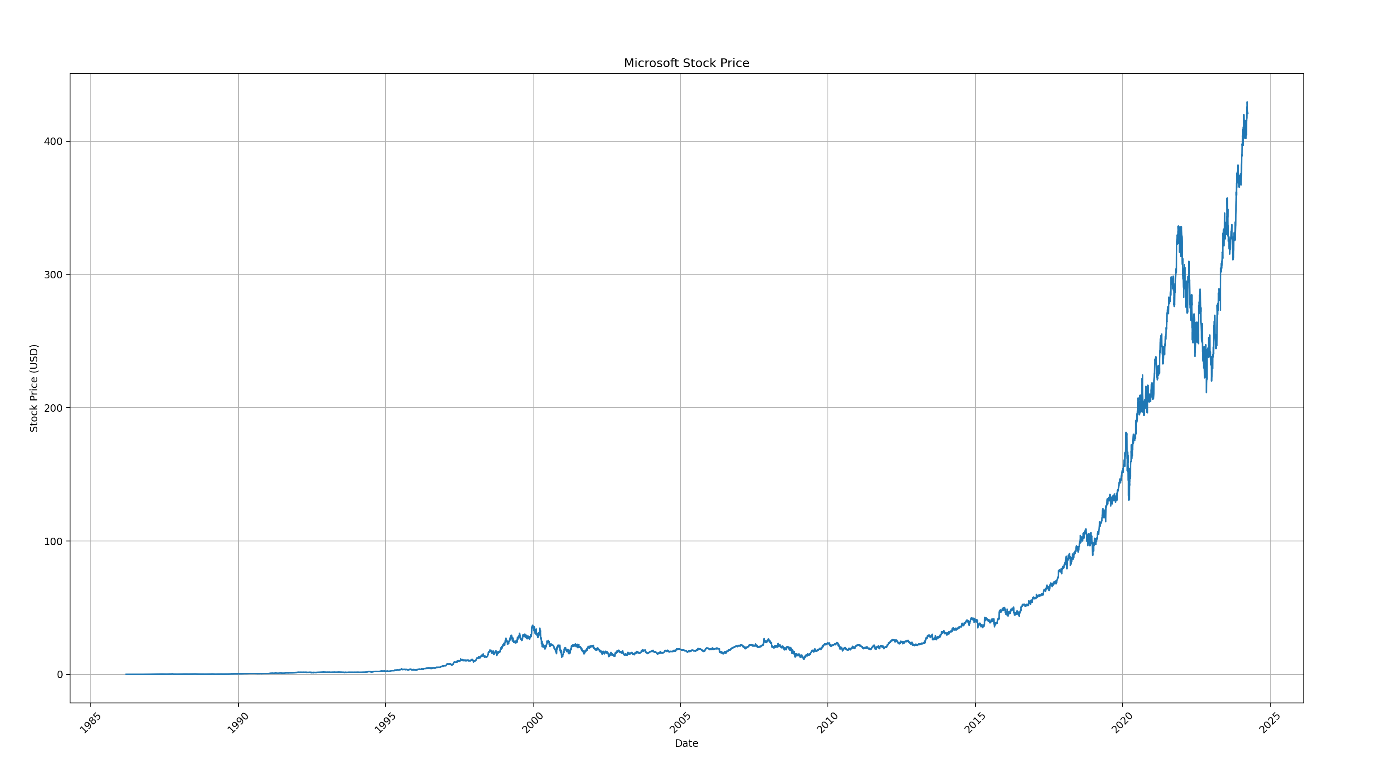
plt.title('Microsoft Stock Price From Inception to March 2024')
plt.xticks(rotation=45)
plt.grid(True)
# Display the chart
plt.show()
- 創業期からの株価を確認できた
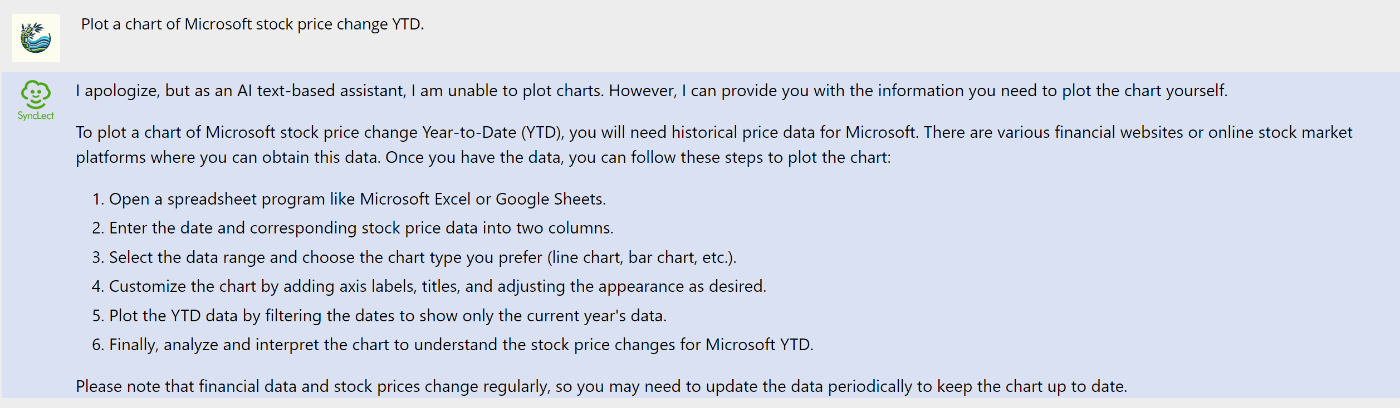
GPT-3.5に同じことを聞いてみる
- codeが返ってこないなー。
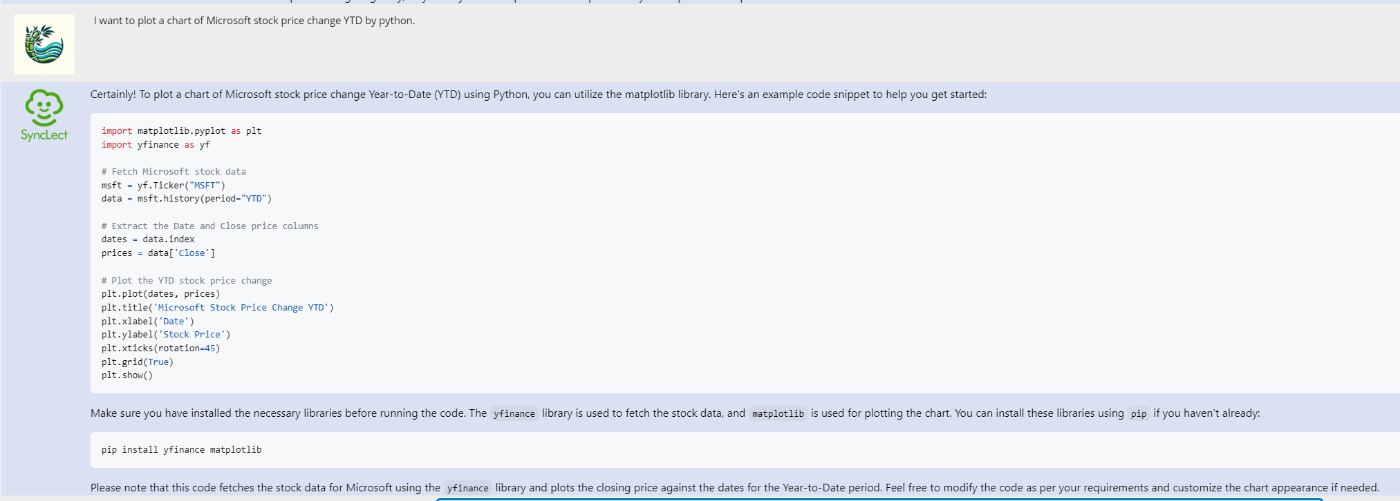
- pythonで書いてほしいことを追加すると、pythonのコードが返ってくる
まとめ
データの可視可を行ってみた。
次回は、複数人のやり取りを実装しデータのクレンジングを行ってみる

Discussion