Prometheus で色々試す
Prometheus で Mac を監視
事務所内のビルドサーバーのMac miniのCPU温度、ファンスピードをPrometheusで拾いたかったので、expoterを適当に作った。
これを sinatra で use MacStats::Exporter してあげればOK
require 'prometheus/client'

module MacStats
  module Controller
    prometheus = Prometheus::Client.registry
    cpu_temp = Prometheus::Client::Gauge.new(:mac_stats_cpu_temp, docstring: 'CPU temperature (Celsius) obtained from the system')
    prometheus.register(cpu_temp)

    fan_speed = Prometheus::Client::Gauge.new(:mac_stats_fan_speed, docstring: 'Fan speed (RPM) obtained from the system', labels: [:unit])
    prometheus.register(fan_speed)
  end
end
require 'prometheus/middleware/exporter'
require_relative './fan_speed'
require_relative './cpu_temp'

module MacStats
  class Exporter < Prometheus::Middleware::Exporter

    def respond_with(format)
      @registry.metrics.each do |metric|
        values = get_metric(metric.name)
        values.each { |v| metric.set(*v) }
      end

      super
    end

    private

    def get_metric(name)
      case name
      when :mac_stats_cpu_temp then CpuTemp.call
      when :mac_stats_fan_speed then FanSpeed.call
      end
    end
  end
end
require "istats"

module MacStats
  class CpuTemp
    extend CPU_STATS

    class << self
      def call
        [cpu_tmp]
      end

      # Get the number of CPU temp
      # Calls a C method from CPU_STATS module
      def cpu_tmp
        get_cpu_temp
      end
    end
  end
end
require "istats"

module MacStats
  class FanSpeed
    extend FAN_STATS

    class << self
      def call
        fan_number.times.map do |n|
          [fan_speed(n), labels: { unit: n }]
        end
      end

      # Get the number of fans speed on system
      # Calls a C method from FAN_STATS module
      def fan_number
        get_fan_number
      end

      # Get the number of fans speed
      # Calls a C method from FAN_STATS module
      def fan_speed(n)
        get_fan_speed(n)
      end
    end
  end
end
気が向いた時にでもリポジトリかなんか作って公開します
Alertmanagerからcalert使ってGoogle Chatに通知する
社内メインチャットツールがGoogle Chatなのだが、Alertmanagerから直接webhookを叩けないようなので、calert を使わせてもらうことに。
一通りDockerでセットアップしてるのでDockerを使うことにしたが、Dockerに関するドキュメントが見当たらなかったので、調べることに。
手元のMacでとりあえず立ち上げる
$ docker run -it --rm mrkaran/calert /bin/sh
別のターミナルで docker inspect を使って、Mounts情報を見ると/etc/calertにボリュームがマウントされているのを確認できた。
[...]
        "Mounts": [
            {
                "Type": "volume",
                "Name": "3d991abc558cbae3e887a998feb36eb67993afbaae9f6829c4d7cf2ff8e1a4a1",
                "Source": "/var/lib/docker/volumes/3d991abc558cbae3e887a998feb36eb67993afbaae9f6829c4d7cf2ff8e1a4a1/_data",
                "Destination": "/etc/calert",
                "Driver": "local",
                "Mode": "",
                "RW": true,
                "Propagation": ""
            }
        ],
[...]
dockerに戻って、中身を確認をすると設定ファイルのありかが確認できた。
~ # ls /etc/calert
config.toml   message.tmpl
config.toml も message.tmpl の内容も、リポジトリにあるサンプルと同じ内容だったので、それらをダウンロードして、設定用のディレクトリに配置、そのディレクトリをマウントすればOK。
あとは、READMEの内容に従えば良さそう。
Grafana 8 Alertsでは通知もGrafanaが行ってるっぽい?
GrafanaはもともとGoogle Chat対応なのでcalertいらない
Grafana 8 Alerts を試す
What's New with Grafana 8 Alerts | Grafana Labs
Grafana にアラート設定機能が追加されていたので、これを使ってみる。
まだ完全版では無いようで、feature_toggles を有効にする必要がある。
At startup, when the feature toggle is enabled, the legacy Grafana dashboard alerting is disabled and existing dashboard alerts are migrated into a format that is compatible with the Grafana 8 alerting system. You can view these migrated rules, alongside any new alerts you create after the migration, from the Alerting page of your Grafana instance.
via Opt-in to Grafana 8 Alerts | Grafana Labs
docker な環境の場合は、ENVで有効にできるので それを使うのが楽そう(既に defaults.ini を自前で用意してる場合はそれを使う方が混乱しない)
ちなみに現状のgrafanaの設定はこんな感じ
...
  grafana:
    image: grafana/grafana
    container_name: prometheus_grafana
    ports:
      - "49210:3000"
    volumes:
      - grafana-config-volume:/etc/grafana
      - grafana-data-volume:/var/lib/grafana
      - grafana-log-volume:/var/log/grafana
    environment:
      - GF_FEATURE_TOGGLES_ENABLE=ngalert
...
リリースを読むだけだとわかりづらかったのだが、通知は Alertmanager を使うようになったそうで、そっちも追加する(旧Grafana Alertの場合はGrafana自体が通知を発行してた)。
...
  alertmanager:
    image: prom/alertmanager
    container_name: prometheus_alertmanager
    ports:
      - "49240:9093"
    volumes:
      - ./alertmanager_config.yml:/etc/alertmanager/config.yml
      - alertmanager-data-volume:/alertmanager
...
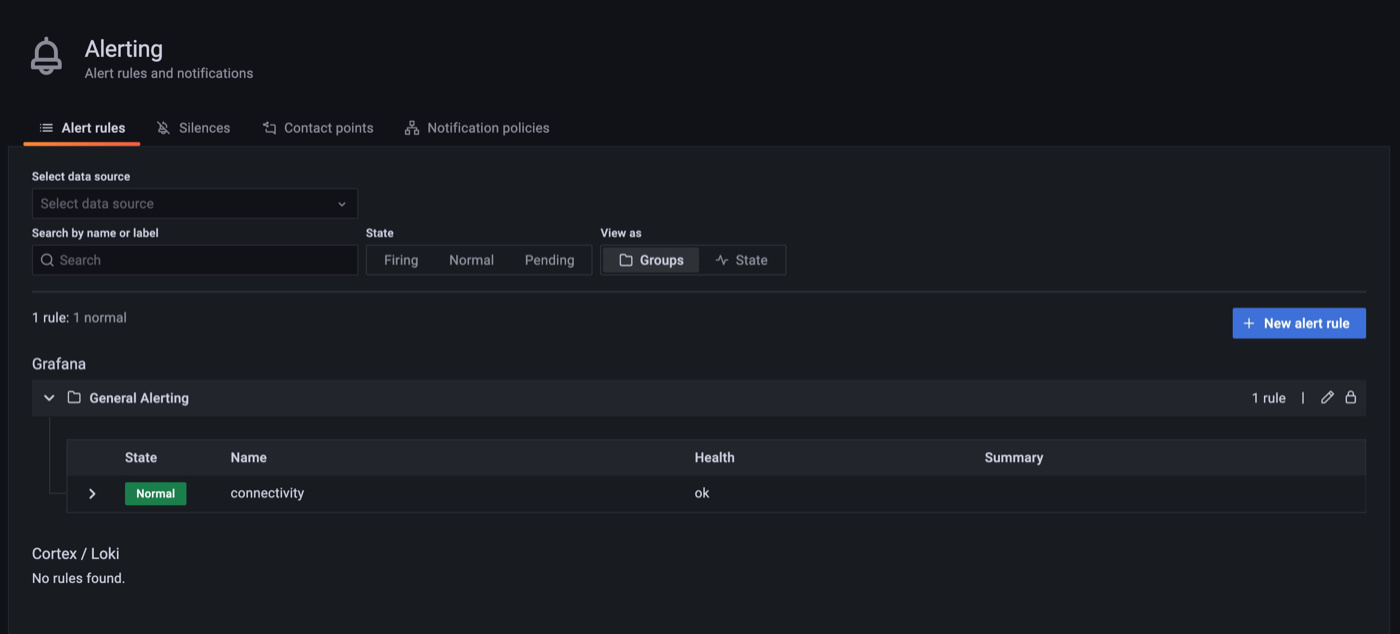
この状態でdocker-composeを実行し、GrafanaのAlertingページ(/alerting/list)を開くと新しいアラート設定画面が出てくる