Kaggleのチュートリアル“Titanic - Machine Learning from Disaster”に挑戦する
これを頑張って理解できるようになりたい
ありがたいことに日本語訳や解説もある
あと、やってて用語が理解出来なさすぎて頭を抱えたので、以下の書籍も利用してます(本の内容をさらうわけではないです)
とりあえずユーザー登録。Googleで登録した。
「New to Kaggle?」という項目にTitanicがある。
コンペティションの他に、データセットやモデルの共有なども出来るみたい(余裕ができたらトライしてみたい)
Overview
Overviewにはコンペティションの参加に必要なことが書かれている
Description
How Kaggle’s Competitions Work に沿う形で進めていきたい。
Rules
Rules acceptance is not required for this competition. Good luck!
らしいが、これからKaggleをやるにあたってルールの雰囲気を知るのは大切なので見てみる。
-
One account per participant
- コンペやるなら当たり前だよね
-
No private sharing outside teams
- 完全に公開するのはOK。非公開コミュニティ等で回すのはNG。
-
Team Merger, Team Limits
- チームが合併するのはOK。1チームは10人まで。
-
Submission Limits
- 1日5回まで。最後の5回がジャッジに利用される。
-
Competition Timeline
- チュートリアルなので終了時刻なし。
Evaluation
タイタニック号の生存者を予測し、以下のようなCSVファイルを作成する。
PassengerId,Survived
892,0
893,1
894,0
Etc.
これを照合し、その正答率が評価対象となる。
はじめ方
Kaggle Notebooksの場合
KaggleにはBuilt-inでJupyter Notebook環境がついてくる。
Code → New Notebook から新しいノートブックを開ける。デフォルトでファイルが用意されている他、以下のようなコードがついてくる。
他にも自前でJupyter Notebookを構築したり、Google Colabなどでやる方法もあるが、まずはこれで始めてみよう。
# This Python 3 environment comes with many helpful analytics libraries installed
# It is defined by the kaggle/python Docker image: https://github.com/kaggle/docker-python
# For example, here's several helpful packages to load

import numpy as np # linear algebra
import pandas as pd # data processing, CSV file I/O (e.g. pd.read_csv)

# Input data files are available in the read-only "../input/" directory
# For example, running this (by clicking run or pressing Shift+Enter) will list all files under the input directory

import os
for dirname, _, filenames in os.walk('/kaggle/input'):
    for filename in filenames:
        print(os.path.join(dirname, filename))

# You can write up to 20GB to the current directory (/kaggle/working/) that gets preserved as output when you create a version using "Save & Run All"
# You can also write temporary files to /kaggle/temp/, but they won't be saved outside of the current session
実行すると、ファイルの一覧が出力される。
/kaggle/input/titanic/train.csv
/kaggle/input/titanic/test.csv
/kaggle/input/titanic/gender_submission.csv
このコードをもとにして、CSVファイルを読み込むコードを書く。
import numpy as np
import pandas as pd
train = pd.read_csv('/kaggle/input/titanic/train.csv')

train.head(4)

これでOK。
データセットの確認
与えられるデータの種類は以下の通り。
| 種類 | 説明 | キー |
|---|---|---|
| PassagerId | Id | int |
| Survival | 生存したか | 0=死亡, 1=生存 |
| Pclass | チケットのランク | 1=1等, 2=2等, 3=3等 |
| Name | 名前 | str |
| Sex | 性別 | male, female |
| Age | 年齢 | float |
| SibSp | 同乗している兄弟・配偶者の数 | int |
| Parch | 同乗している親・子供の数 | int |
| Ticket | チケット番号 | str |
| Fare | 運賃 | float |
| Cabin | キャビン番号 | str |
| Embarked | 出港した港 | C=Cherbourg, Q=Queenstown, S=Southampton |
まずはSubmitしてみる
このコンペティションにはデータとしてgender_submission.csvというファイルが付属している。これは女性を全て生存、男性を全て死亡に分類した際の最終データとなる。
これをSubmitする前に、まずはこれがある程度信頼できるものなのか確認する。
train.groupby('Sex').apply(lambda x: x[x['Survived'] == 1]['Survived'].count() / x['Survived'].count())
Sex
female    0.742038
male      0.188908
dtype: float64
女性の生存率が74%なのに対し、男性の生存率は19%程度で、かなり有意な差があることが分かる。確かに、これは使えそう。
では、Submitしてみる。
gender_submission = pd.read_csv('/kaggle/input/titanic/gender_submission.csv')
sub = gender_submission.to_csv("submission.csv", index=False)
実行すると、submission.csvというファイルが出来る。右のパネルからSubmitを押すと自動で送信され、しばらくするとLeaderboardにScoreが現れる。結果は0.76555。

データの前処理
欠損値の処理
train.isnull().sum()
PassengerId      0
Survived         0
Pclass           0
Name             0
Sex              0
Age            177
SibSp            0
Parch            0
Ticket           0
Fare             0
Cabin          687
Embarked         2
dtype: int64
Ageは中央値か平均値で補完かな?Cabinはあまりにも欠損してるしバッサリ消しちゃったほうが良さそう
Cabinの除外
先述した欠損数の多さに加え、Cabinにはキャビン番号が振られているが、これを補完するのは難しく、かつデータとして生存か否かの判断に利用する価値があまりない。よってこの項目は除外してしまう。
train.drop('Cabin', axis=1, inplace=True)
AgeとEmbarkedの補完
Ageは中央値、EmbarkedはSで補完したら良さげだった。
train['Age'].fillna(train['Age'].median(),inplace = True)
train['Embarked'].fillna('S',inplace = True)
これで欠損値が無くなった。
変数の離散化
機械学習モデルに読み込ませる際に、数値でない型は都合が悪いので、変換処理を行う。
train['Sex'].replace(['male', 'female'], [0, 1], inplace=True)
train['Embarked'].replace(['S', 'C', 'Q'], [0, 1, 2], inplace=True)
データの可視化
matplotlib及びseabornを用いてデータを可視化する。
import seaborn as sns
import matplotlib.pyplot as plt
Age
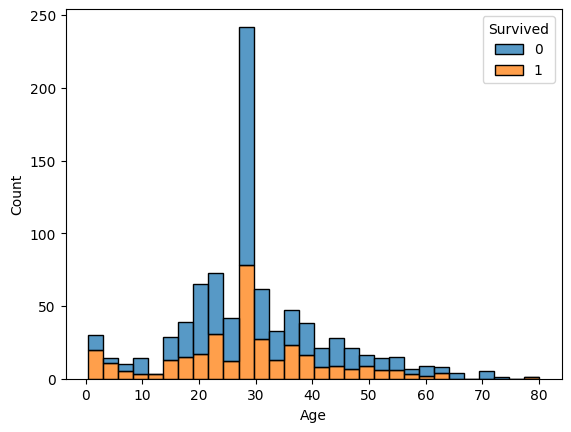
sns.histplot(data=train, x="Age", hue="Survived", multiple="stack")
sns.histplot(data=train, x="Age", hue="Survived", multiple="fill")
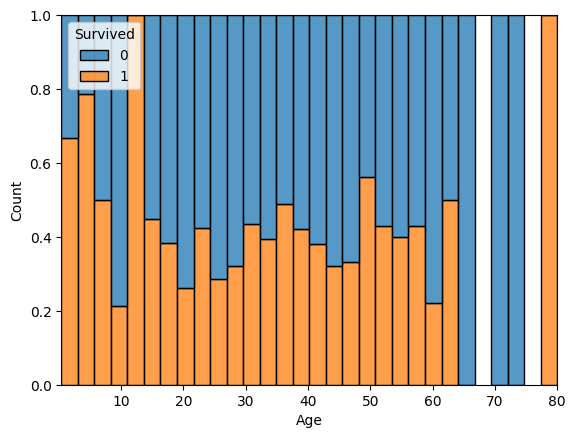
若い人のほうが生存率高そう。
SibSp
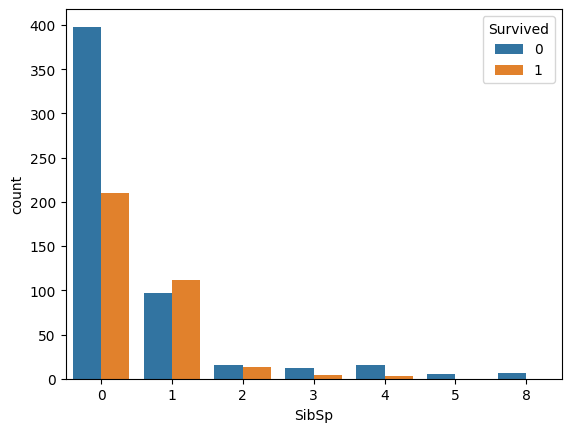
sns.countplot(data=train, x='SibSp', hue='Survived')
Parch
sns.countplot(data=train, x='Parch', hue='Survived')
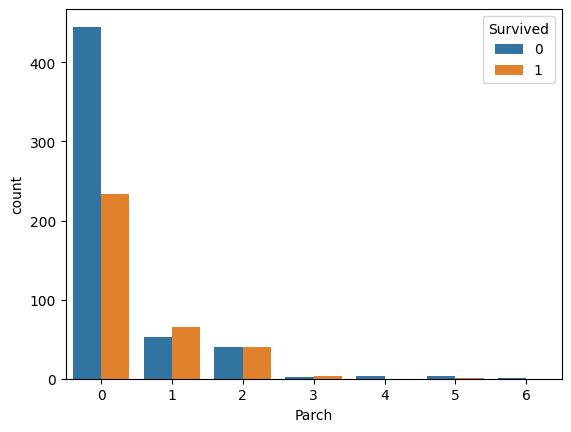
どちらも1人のときと2人以上いるときでは生存率に違いが出る。
Fare
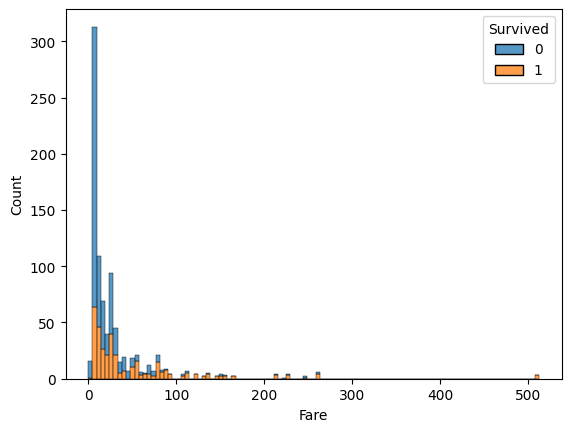
sns.histplot(data=train, x="Fare", hue="Survived", multiple="stack")
Pclass
sns.countplot(data=train, x='Pclass', hue='Survived')
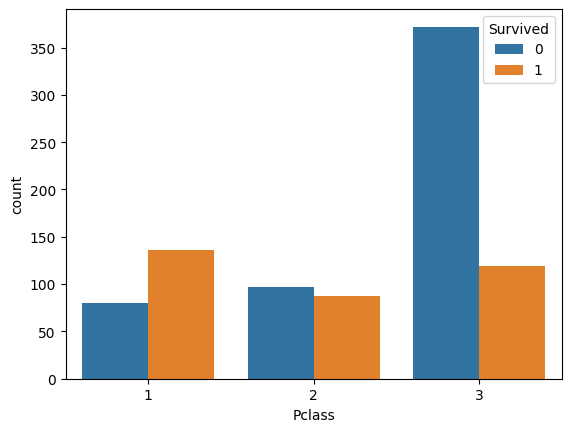
どちらも多いほうが生存率が高くなる。高いグレードの席の人から避難できたようなのでこれは分かりやすい。
Sex
sns.countplot(data=train, x='Sex', hue='Survived')

確認した通り。
Embarked
sns.countplot(data=train, x='Embarked', hue='Survived')
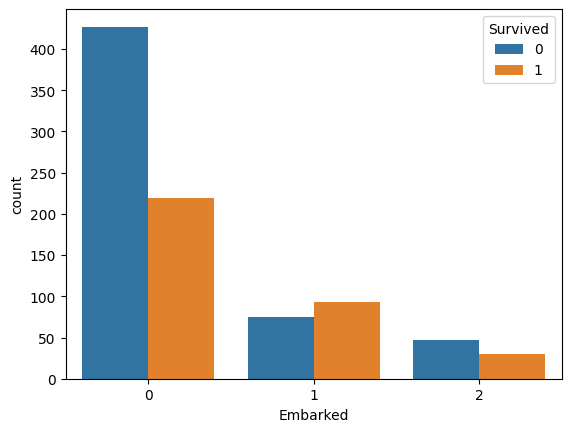
Sのときの死亡率が明らかに高い。
新しい特徴量の作成
データを見ると、SibSpは同乗している兄弟や配偶者の数、Parchは同乗している親や子供の数であるため、合わせて1つの特徴量にしたほうが良さそうということが分かる。そこで、「Family」という新しい特徴量を作成する。
train['Family'] = train['Parch'] + train['SibSp']
sns.countplot(data=train, x='Family', hue='Survived')

より生存率がはっきり出て分かりやすくなった。
機械学習アルゴリズムへ
ロジスティック回帰モデル
ロジスティック回帰モデルは、与えられたデータから0か1かのどちらかを予測分析するモデルである。
ロジスティック回帰分析で用いられる式は以下の通りである。
(

ホールドアウト法による過学習の回避
機械学習において、訓練データに寄りすぎるあまり訓練データ以外のデータに対して予測ができなくなることを過学習と呼ぶ。これを避けるため、訓練データの一部をValid用に用いることにする。これをホールドアウト法と呼ぶ。
機械学習ライブラリのscikit-sklearnにはtrain_test_splitというランダムにValid用のデータを作成してくれる関数がある。
from sklearn.model_selection import train_test_split

# ロジスティック回帰ではStrが使えないので消す
delete_columns = ['Name', 'PassengerId', 'Ticket']
train.drop(delete_columns, axis=1, inplace=True)
test.drop(delete_columns, axis=1, inplace=True)

X = train.iloc[:, 1:].values
y = train.iloc[:, 0].values
X_test = test.iloc[:, 0:].values

X_train, X_valid, y_train, y_valid = train_test_split(X, y, test_size=0.3, random_state=1729)
ロジスティック回帰モデルの実装
#ロジスティック回帰モデル
from sklearn.linear_model import LogisticRegression

clf = LogisticRegression(penalty='l2', random_state=1729)

clf.fit(X_train, y_train)

print('Train Score: {}'.format(round(clf.score(X_train, y_train), 3)))
print(' Test Score: {}'.format(round(clf.score(X_valid, y_valid), 3)))

y_pred = clf.predict(X_test)
submission['Survived'] = y_pred
submission.to_csv('submission.csv', index=False)
submission
Train Score: 0.812
 Test Score: 0.754
SubmitしたScoreは0.75598。
ここまでのコード
