Vuetify 3 と Apexcharts の実装(Vuetify 2 〜 Vuetify 3 アップデート)
グラフ系のライブラリは、Apexcharts を Vue 2 / Nuxt 2 / Vuetify 2 では利用していた。
Vuetify 3 のアップデートでも同様に利用できることから変更された点についてまとめてみた。
変更点
- Apexcharts のラッパーライブラリの変更
- セットアップ方法の変更
- グラフのツールチップをVueのコンポーネントでカスタマイズしてた場合
Apexcharts の変更点は、👆だけになりますが基本的にはVueの変更された部分の影響が大きいです。
グラフで利用するオプションの設定などは基本は変わりません。
検証バージョン
- Apexcharts 3.49.1
- vue3-apexcharts 1.5.3
Apexcharts のインストール
Apexcharts には、Angular, React, Vue などのラッパーライブラリが用意されています。
このラッパーライブラリをインストールをすることで、Vueのコンポーネントとして利用することできます。
インストールは公式のドキュメントに従って行います。
変更点としては、Vue 2 では vue-apexcharts を利用していましたが、Vue 3 では vue3-apexcharts を利用することになります。
- Vue 2 -> vue-apexcharts
- Vue 3 -> vue3-apexcharts
リポジトリが変更されているため、環境に応じてライブラリを変更する必要があります。
Vue 4になったら、このラッパーライブラリもリポジトリが変わるかは不明ですが、現時点でリポジトリは変更されているため注意が必要です。
Vue2 では、new Vue() で Vue インスタンスを生成していましたが、Vue 3 では createApp() で Vue インスタンスを生成するようになりました。
npm install --save apexcharts
npm install --save vue-apexcharts
import VueApexCharts from 'vue-apexcharts'
Vue.use(VueApexCharts)

Vue.component('apexchart', VueApexCharts)
npm install --save apexcharts
npm install --save vue3-apexcharts
import VueApexCharts from "vue3-apexcharts";

const app = createApp(App);
app.use(VueApexCharts);
// The app.use(VueApexCharts) will make <apexchart> component available everywhere.
Vite 環境
Vite構成の場合は、 main.ts に以下のように記述します。
サンプルコードは、Vuetify 3 と組み合わせた形になります。
import { createApp } from 'vue'
import './style.css'
// Vuetify
import 'vuetify/styles'
import { createVuetify } from 'vuetify'
import * as components from 'vuetify/components'
import * as directives from 'vuetify/directives'
import VueApexCharts from "vue3-apexcharts";  // Add this line

import App from './App.vue'

const vuetify = createVuetify({
  components,
  directives,
})

createApp(App)
  .use(vuetify)
  .use(VueApexCharts) // Add this line
  .mount('#app')
Nuxt 3 環境
Nuxt 3 の場合は、pulguinsに記述することで、グローバルで <apexchart /> を利用することができます。
Apexcharts は、ブラウザで動作するため、clientOnly が必要になるため、プラグイン名に client を付ける必要があります。
そのため apexcharts.client.ts としています。
import VueApexCharts from 'vue3-apexcharts'

export default defineNuxtPlugin((nuxtApp) => {
  nuxtApp.vueApp.use(VueApexCharts)
  nuxtApp.vueApp.component('apexchart', VueApexCharts)
})
Storybook 環境
Storybook を利用している場合は、.storybook/previews.js に記述することで、 <apexchart /> を認識してStorybook上でグラフを描画することができます。
import type { Preview } from "@storybook/vue3";
import { setup } from '@storybook/vue3'
import vuetify from "../src/utils/vuetify";
import VueApexCharts from 'vue3-apexcharts'  // Add this line

setup((app) => {
  if (app) {
    app.use(vuetify)
    app.use(VueApexCharts)  // Add this line
  }
})
利用方法
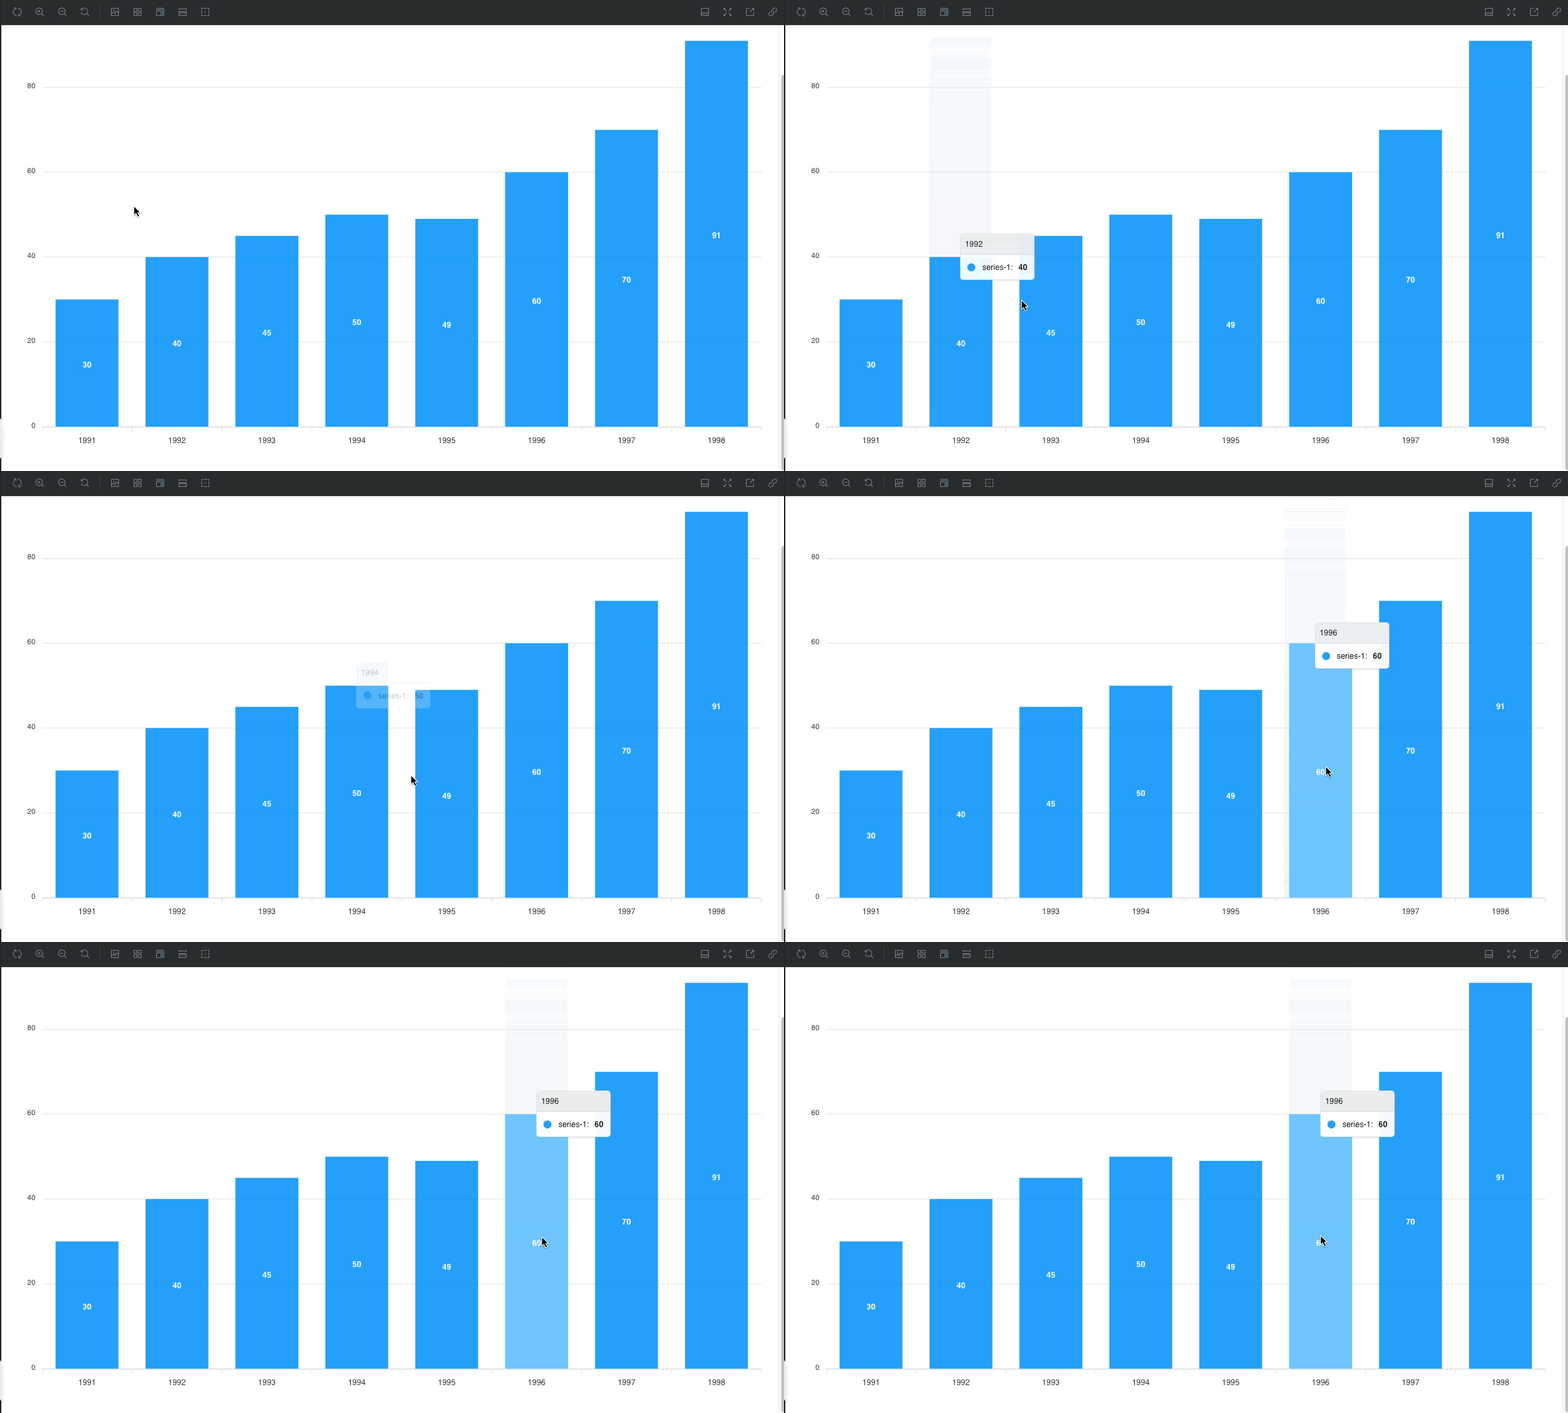
Apexcharts の利用方法は、Vue 2 と Vue 3 で変更点は基本的にありません。
Vuetify 3 にアップデートに伴って、Composition API で利用する場合のサンプルコードを紹介します。

Vue2 と同様に Options と Series になります。
ここでは、options と series を ref で定義して apexchart に渡します。
同名のプロパティになるため、v-bind で options と series を渡すことも可能です。
  <apexchart type="bar" :options="options" :series="series" />
  <apexchart type="bar" v-bind="{ options, series }" />
<script setup lang="ts">
import { ref } from 'vue'

const options = ref({
  chart: {
    id: 'vuechart-example'
  },
  xaxis: {
    categories: [1991, 1992, 1993, 1994, 1995, 1996, 1997, 1998]
  },
})

const series = ref([{
  name: 'series-1',
  data: [30, 40, 45, 50, 49, 60, 70, 91]
}])
</script>

<template>
  <apexchart type="bar" v-bind="{ options, series }" />
</template>
ツールチップのカスタマイズ

Apexchartsでは、グラフ内のツールチップをカスタマイズすることができます。
tooltip オプションに custiom オプションを設定することで独自のHTMLを差し込むことができます。
tooltip: {
  custom: function({series, seriesIndex, dataPointIndex, w}) {
    return '<div class="arrow_box">' +
      '<span>' + series[seriesIndex][dataPointIndex] + '</span>' +
      '</div>'
  }
}
ツールチップにVueのコンポーネントを差し込んでる場合は、Vue 3 にアップデートする際に注意が必要です。
Vue2では、以下のような共通関数として用意して、Vue.extend を利用して 特定のコンポーネントを呼び出しインスタンスからHTMLを返すように実装していました。
コンポーネントを指定して、propsにグラフの情報を渡すことで、HTMLを返していました。
import Vue from 'vue'

export const toInnerHTML = (component, propsData) => {
  const Component = Vue.extend(component)
  const instance = new Component({ propsData })
  instance.$mount()
  return instance.$el.innerHTML
}
<script>
export default {
  // ~~~ 省略 ~~~
  computed: {
    tooltip() {
      return {
        custom: ({ series, seriesIndex, dataPointIndex, w }) => {
          return toInnerHTML(MyComponent, { value: series[seriesIndex][dataPointIndex] })
        }
      }
    }
  }
  // ~~~ 省略 ~~~
}
</script>
Vue 3では、Vue.extend が廃止されていることから defineComponent と h関数を利用するようにコードを変更する必要があります。
- Vue.extend -> defineComponent
- new Component -> h(render関数)
具体的には、defineComponent を定義したプロパティに render の返り値に h関数に利用したい引数の component と props に渡して実行します。
作成した Component を createApp に渡しておきます。
innerHTML でコンポーネントのHTMLを挿入できるように、 document.createElement('div') を定義しておきます。
作成した div の中に コンポーネントを入れ込むために app.mount(root) でマウントします。
最終的に htmlを tooltip のcustom にHTMLを流し込むため、 root.innerHTML で htmlの変数を用意します。この変数をtooltipのcustomに渡します。
HTMLを作り終えたら、マウントしたコンポーネントは不要になるため、app.unmount() を実行します。
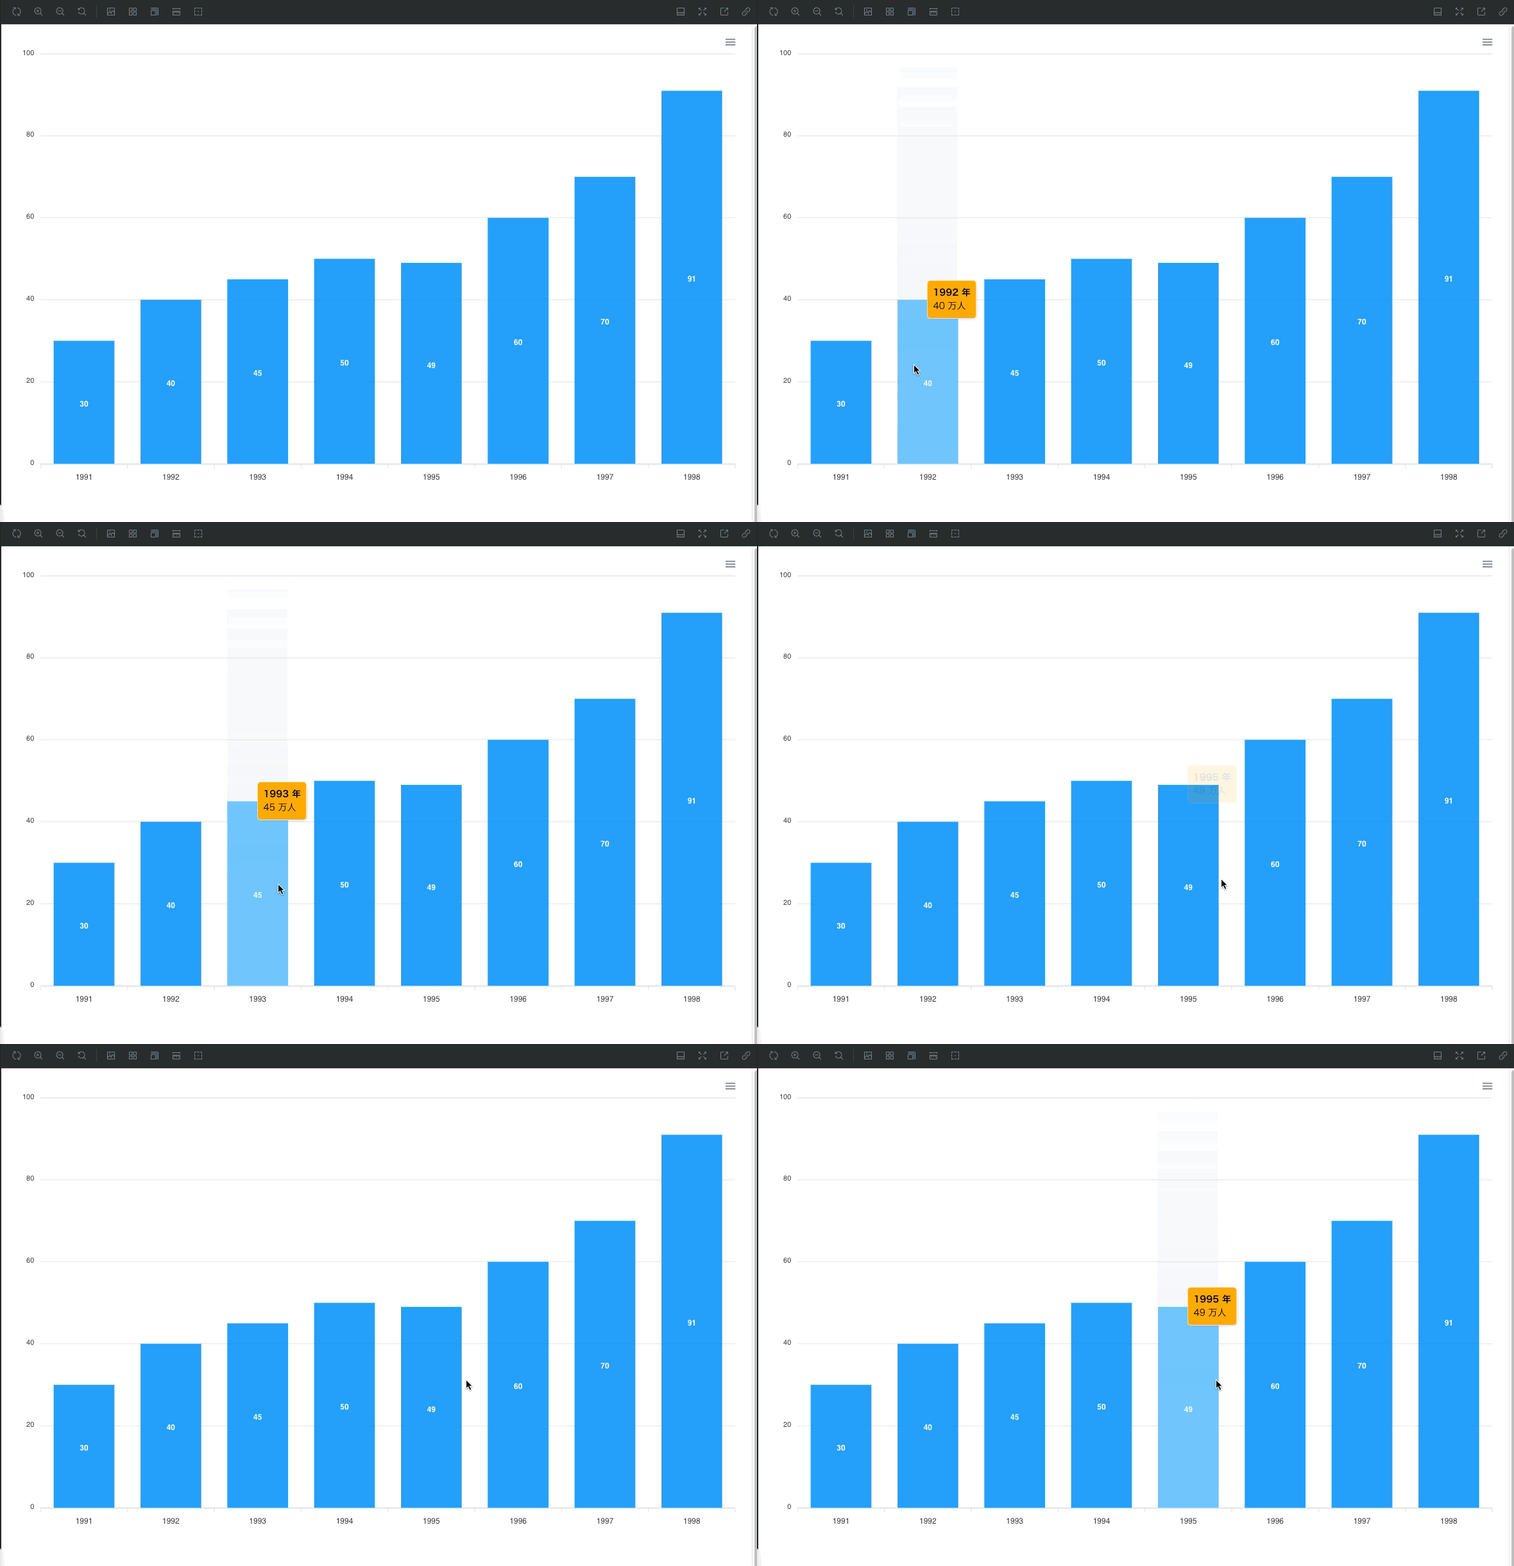
ツールチップに定義したコンポーネントを表示させることできます。
import { defineComponent, createApp, h } from 'vue'

export const toInnerHTML = (component, propsData) => {
  const Component = defineComponent({
    render() {
      return h(component, propsData)
    },
  })

  const app = createApp(Component)
  const root = document.createElement('div')
  app.mount(root)
  const html = root.innerHTML
  app.unmount()
  return html
}
次に利用側のコードとツールチップで利用するコンポーネントを作成します。
先ほどのx軸の categories とy軸の data を text と data の propsに渡すように設定します。
<script setup lang="ts">
const props = defineProps<{
  text: string,
  data: string
}>()
</script>

<template>
  <v-card color="#CCC" class="bg-amber-accent-4 pa-2">
    <v-card-title class="font-weight-bold">
      {{ props.text }}
    </v-card-title>
    <v-card-text>
      <div>{{ props.data }}</div>
    </v-card-text>
  </v-card>
</template>
ApexCharts.vue に作成した Tooltip.vueを呼び出すように設定します。
options に tooltip の custom に設定し、toInnerHTML で Tooltip.vue を呼び出し、propsに text と data に値を渡します。
 <script setup lang="ts">
 import { ref } from 'vue'
+ import { toInnerHTML } from '@/utils/toInnerHTML'
+ import Tooltip from '@/components/ApexCharts/Tooltip.vue'

 const options = ref({
   chart: {
     id: 'vuechart-example'
   },
   xaxis: {
     categories: [1991, 1992, 1993, 1994, 1995, 1996, 1997, 1998]
   },
+  tooltip: {
+    custom: ({ series, seriesIndex, dataPointIndex, w }) => toInnerHTML(Tooltip, {
+      text: `${w.globals.labels[dataPointIndex]} 年`,
+      data: `${series[seriesIndex][dataPointIndex]} 万人`
+    })
+  }
 })

 const series = ref([{
   name: 'series-1',
   data: [30, 40, 45, 50, 49, 60, 70, 91]
 }])
 </script>

 <template>
   <apexchart type="bar" :options="options" :series="series" />
 </template>
customで取得できる引数
- ctx
- dataPointIndex
- series
- seriesIndex
- w
- y1
- y2
まとめ
Apexcharts を、Vue 3で利用する場合の変更点をまとめました。
今回は、Vue2 から Vue3へアップデートすることでの変更点にフォーカスしました。
Apexcharts自体の利用する部分についての変更はありませんでした。
カスタマイズといった部分やラッパーの変更といった部分が主な変更点でした。
グラフ系のカスタマイズは、頻繁に行うことが多いので、アップデートで Apexcharts を利用している場合は参考にしてみてください。
サンプルコードとデモ
Discussion