🌊
Pythonで財務分析3 ~ROAツリーをPlotly Dashで可視化~
はじめに
前回はEDINET APIで取得したデータからROAツリー作成に必要なデータを抽出するところまでできました。
今回はROAツリーの可視化の部分を紹介します。
やりたいこと
こんな感じのツリー構造のグラフを表示させたい。
ROA
|--総資産回転率
| |--固定資産回転率
| |--有形固定資産回転率
| |--無形固定資産回転率
| |--運転資金回転日数
| |--売掛債権回転日数
| |--買掛債権回転日数
| |--在庫回転日数
|--営業利益率
| |--原価率
| |--販管費率
そのために必要なデータはかなり泥臭い手作業の末揃ったので、あとはPythonで可視化するのみです。
今回は手元環境で財務分析できれば良いのでPlotly Dashを使用することにしました。
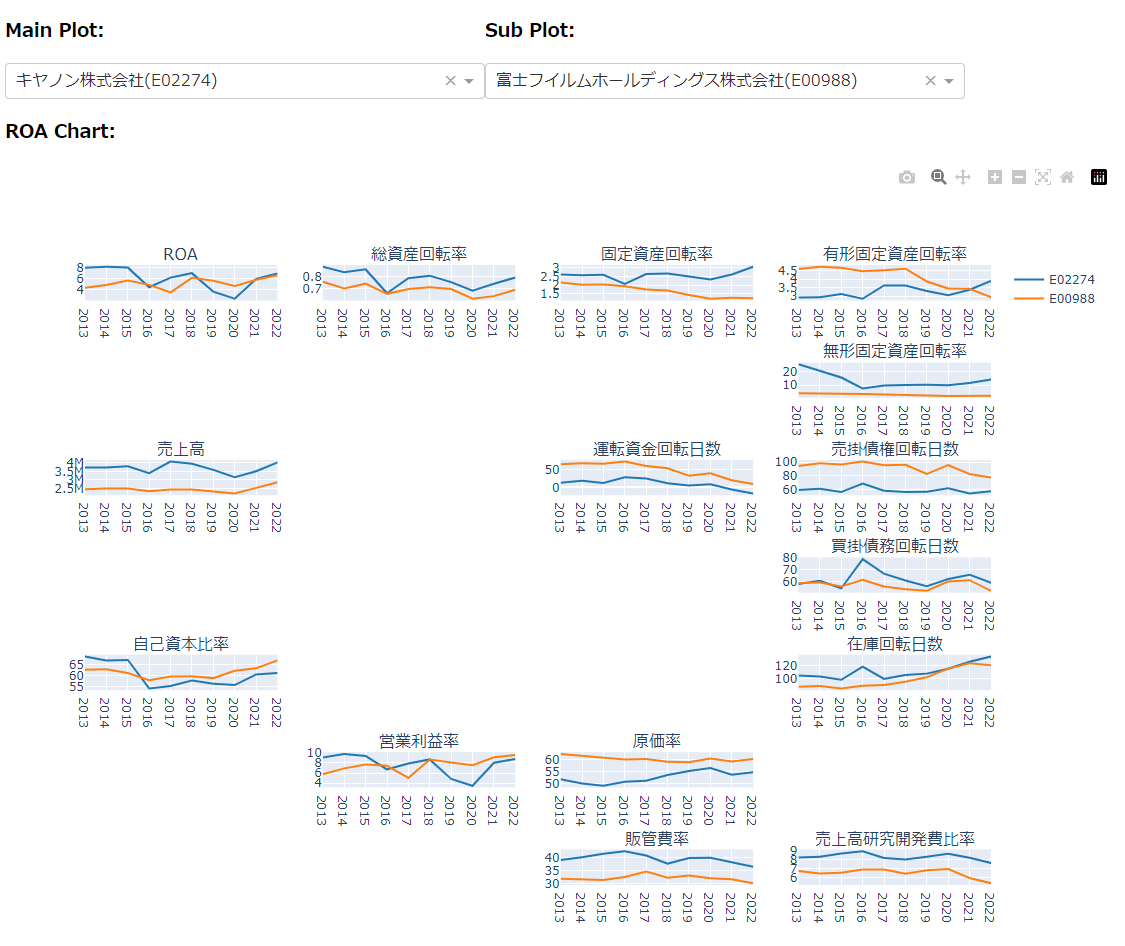
完成図
せっせとコーディングした結果、以下のようなものが完成しました。
前回、前々回ほどハマることはなく、ChatGPTさんにPlotlyの使い方を教えてもらいながら完成イメージに近づけることができました。
まとめ
3回の記事に渡ってEDINETからデータを取得しROAツリーを表示するまでの取り組みを紹介しました。
データの取得、可視化はAPIやOSSの活用で比較的スムーズに進みましたが、データの抽出、いわゆるデータクレンジングの部分で非常に苦労しました。今回は苦渋の選択で目視&コピペの人力作業を含む形となってしまいましたが、「レンダリングされた有価証券報告書を画像認識して所望の財務データを抽出するAI」があれば完全自動化も夢ではなかったかもしれません。今後はこの路線での実現方法を模索してみたいと思いました。
最後に、今回のソースコードも部分的にでも参考になればと思い、公開します。
import os
from pathlib import Path
import pandas as pd
import plotly.express as px
import plotly.graph_objects as go
from plotly.subplots import make_subplots
import dash
from dash import html
from dash import dcc
from dash.dependencies import Input, Output, State

app = dash.Dash(__name__, update_title=None)

def main():
    try:
        # 選択肢の準備
        root_dpath = os.path.join(Path(__file__).parent.parent, "data")

        if os.path.exists(root_dpath) == False:
            print("data directry was not found.")
            raise Exception()

        edinet_codes = []
        for curdir, dirs, files in os.walk(root_dpath):
            if curdir.endswith("01_dst") == False:
                continue

            if "roatree.csv" in files:
                code = curdir.split("\\")[-2].split("/")[-1]
                filer_fpath = os.path.join(root_dpath, code, "filername.txt")
                with open(filer_fpath, "r", encoding='utf8') as f:
                    filer_name = f.read()
                o_d = {"label": f'{filer_name}({code})', "value": code}
                edinet_codes.append(o_d)
        print(edinet_codes)

        # Dash
        app.layout = html.Div(children=[
            # 制御エリア
            html.Div([
                html.Div([
                    html.H3("Main Plot:"),
                    dcc.Dropdown(id="mainSelectableCode", options=edinet_codes, value=None),
                ], style={"width": "480px"}),

                html.Div([
                    html.H3("Sub Plot:"),
                    dcc.Dropdown(id="subSelectableCode", options=edinet_codes, value=None),
                ], style={"width": "480px"}),
            ], style={'display': 'flex'}),

            # グラフエリア
            html.Div([
                html.H3("ROA Chart:"),
                dcc.Graph(id="graph", style={"width": "100%"}, config={'displayModeBar': True})
            ], style={"height": "100 %"}),

        ], style={"width": "96%", 'display': 'flex', 'flex-direction': 'column'})

        app.title = "ROA Tree"
        app.run_server(host='0.0.0.0', port=5000, debug=False, use_reloader=False)

    except Exception as ex:
        print(ex)

    # utils.wait_exit()

@app.callback(
    Output("graph", "figure"),
    Input("mainSelectableCode", "value"),
    Input("subSelectableCode", "value"),
    prevent_initial_call=True
)
def update_figure(mainSelected, subSelected):
    fig = make_subplots(rows=7, cols=4,
                        vertical_spacing=0.1, horizontal_spacing=0.05,
                        subplot_titles=("ROA", "総資産回転率", "固定資産回転率", "有形固定資産回転率",
                                        "", "", "", "無形固定資産回転率",
                                        "売上高", "", "運転資金回転日数", "売掛債権回転日数",
                                        "", "", "", "買掛債務回転日数",
                                        "自己資本比率", "", "", "在庫回転日数",
                                        "", "営業利益率", "原価率", "",
                                        "", "", "販管費率", "売上高研究開発費比率"
                                       ))

    root_dpath = os.path.join(Path(__file__).parent.parent, "data")

    if mainSelected != None:
        print(mainSelected)
        csv_fpath = os.path.join(root_dpath, mainSelected, "01_dst", "roatree.csv")
        df = pd.read_csv(csv_fpath, encoding='shift-jis', index_col=0)
        main_plot_style = {'color': '#1f77b4'}
        build_tree(fig, df, mainSelected, main_plot_style)

    if subSelected != None:
        print(subSelected)
        csv_fpath = os.path.join(root_dpath, subSelected, "01_dst", "roatree.csv")
        sub_df = pd.read_csv(csv_fpath, encoding='shift-jis', index_col=0)
        sub_plot_style = {'color': '#ff7f0e'}
        build_tree(fig, sub_df, subSelected, sub_plot_style)

    fig.update_layout(autosize=True, height=800)
    return fig

def build_tree(fig, org_df, legend, plot_style):
    # calc
    t_df = org_df.apply(lambda ser: ser.str.replace(",", "")).astype(float).T

    ser1 = t_df["050_営業利益"]/t_df["110_資産合計"] * 100
    ser1.name = "200_ROA"

    ser2 = t_df["010_売上高"]/t_df["110_資産合計"]
    ser2.name = "300_総資産回転率"

    ser3 = t_df["010_売上高"]/t_df["130_固定資産"]
    ser3.name = "310_固定資産回転率"

    ser4 = t_df["010_売上高"]/t_df["131_有形固定資産"]
    ser4.name = "311_有形固定資産回転率"

    ser5 = t_df["010_売上高"]/t_df["132_無形固定資産"]
    ser5.name = "312_無形固定資産回転率"

    ser7 = t_df["121_売上債権"]/(t_df["010_売上高"] / 365)
    ser7.name = "321_売掛債権回転日数"

    ser8 = t_df["151_買入債務"]/(t_df["020_売上原価"] / 365)
    ser8.name = "322_買掛債務回転日数"

    ser9 = t_df["122_棚卸資産"]/(t_df["020_売上原価"] / 365)
    ser9.name = "323_在庫回転日数"

    ser6 = ser7 + ser8 - ser9
    ser6.name = "320_運転資金回転日数"

    ser10 = t_df["050_営業利益"]/t_df["010_売上高"] * 100
    ser10.name = "400_営業利益率"

    ser11 = t_df["020_売上原価"]/t_df["010_売上高"] * 100
    ser11.name = "410_原価率"

    ser12 = t_df["040_販管費"]/t_df["010_売上高"] * 100
    ser12.name = "420_販管費率"

    ser13 = t_df["041_研究開発費"]/t_df["010_売上高"] * 100
    ser13.name = "421_売上高研究開発費比率"

    ser14 = t_df["171_株主資本等"]/t_df["110_資産合計"] * 100
    ser14.name = "500_自己資本比率"

    roa_df = pd.concat([ser1, ser2, ser3, ser4, ser5, ser6, ser7, ser8, ser9, ser10, ser11, ser12, ser13, ser14], axis=1)
    df = pd.concat([t_df, roa_df], axis=1)

    # add drace
    fig.add_trace(go.Scatter(x=df.index, y=df["200_ROA"], mode="lines", name=legend, line=plot_style, showlegend=True), row=1, col=1)
    fig.add_trace(go.Scatter(x=df.index, y=df["300_総資産回転率"], mode="lines", name=legend, line=plot_style, showlegend=False), row=1, col=2)
    fig.add_trace(go.Scatter(x=df.index, y=df["310_固定資産回転率"], mode="lines", name=legend, line=plot_style, showlegend=False), row=1, col=3)
    fig.add_trace(go.Scatter(x=df.index, y=df["320_運転資金回転日数"], mode="lines", name=legend, line=plot_style, showlegend=False), row=3, col=3)
    fig.add_trace(go.Scatter(x=df.index, y=df["311_有形固定資産回転率"], mode="lines", name=legend, line=plot_style, showlegend=False), row=1, col=4)
    fig.add_trace(go.Scatter(x=df.index, y=df["312_無形固定資産回転率"], mode="lines", name=legend, line=plot_style, showlegend=False), row=2, col=4)
    fig.add_trace(go.Scatter(x=df.index, y=df["321_売掛債権回転日数"], mode="lines", name=legend, line=plot_style, showlegend=False), row=3, col=4)
    fig.add_trace(go.Scatter(x=df.index, y=df["322_買掛債務回転日数"], mode="lines", name=legend, line=plot_style, showlegend=False), row=4, col=4)
    fig.add_trace(go.Scatter(x=df.index, y=df["323_在庫回転日数"], mode="lines", name=legend, line=plot_style, showlegend=False), row=5, col=4)
    fig.add_trace(go.Scatter(x=df.index, y=df["400_営業利益率"], mode="lines", name=legend, line=plot_style, showlegend=False), row=6, col=2)
    fig.add_trace(go.Scatter(x=df.index, y=df["410_原価率"], mode="lines", name=legend, line=plot_style, showlegend=False), row=6, col=3)
    fig.add_trace(go.Scatter(x=df.index, y=df["420_販管費率"], mode="lines", name=legend, line=plot_style, showlegend=False), row=7, col=3)
    fig.add_trace(go.Scatter(x=df.index, y=df["421_売上高研究開発費比率"], mode="lines", name=legend, line=plot_style, showlegend=False), row=7, col=4)
    fig.add_trace(go.Scatter(x=df.index, y=df["010_売上高"], mode="lines", name=legend, line=plot_style, showlegend=False), row=3, col=1)
    fig.add_trace(go.Scatter(x=df.index, y=df["500_自己資本比率"], mode="lines", name=legend, line=plot_style, showlegend=False), row=5, col=1)

if __name__ == '__main__':
    main()
Discussion