🎉
Plotly の Radar Chart をシンプルにする
はじめに
Plotly では Radar Chart を出力できます。
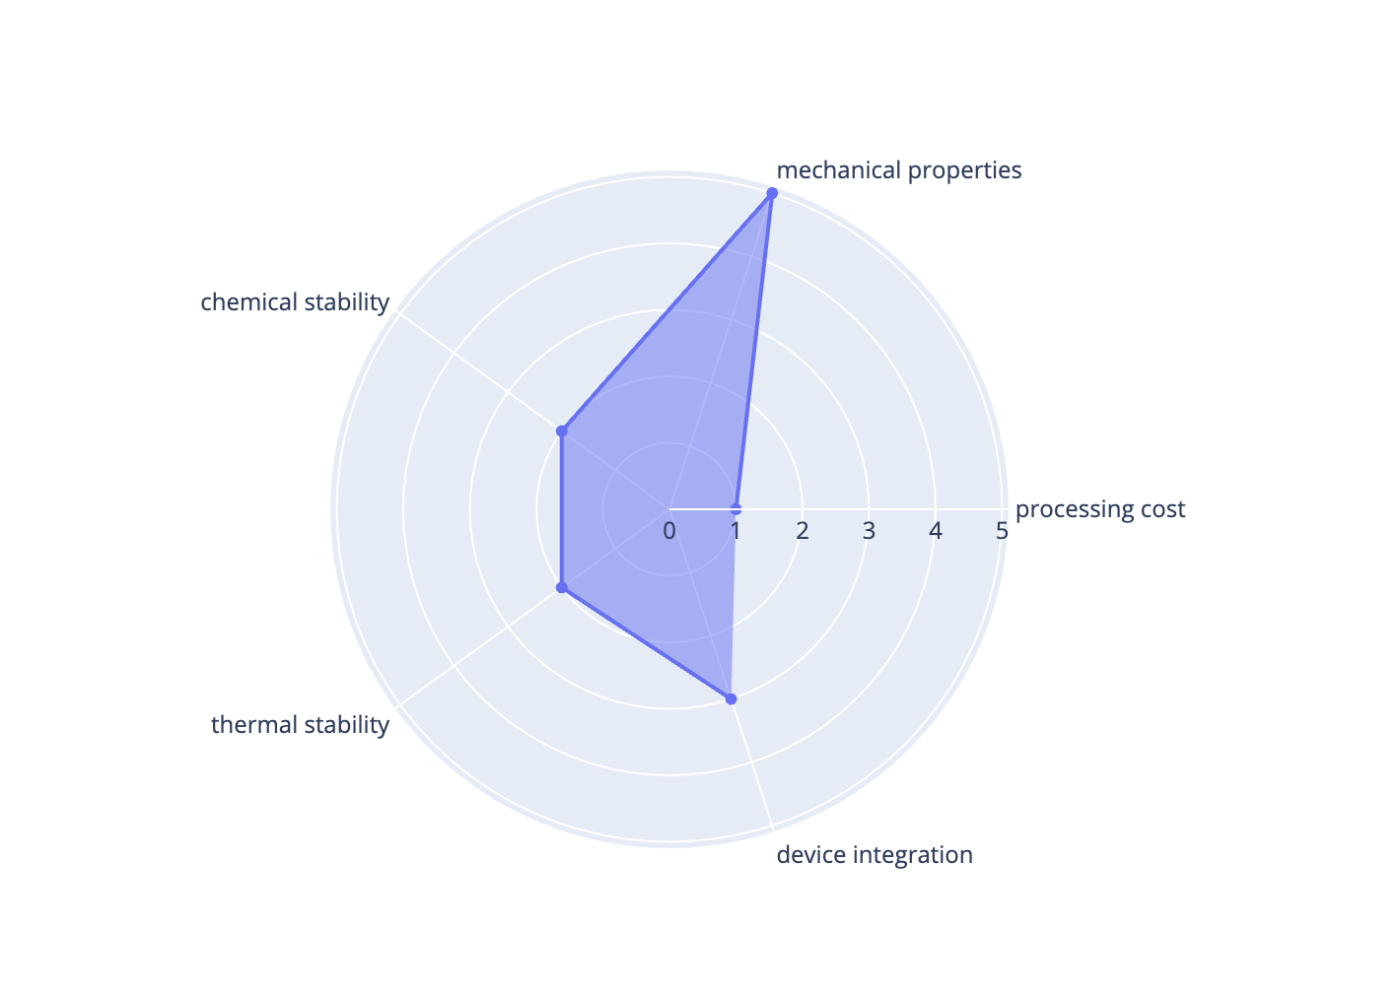
しかし,デフォルトのままでは以下のように少し見た目が派手です。
- 色が塗りつぶされている
- 背景が青い
- 丸い円が何個も連なっている
論文に利用する場合は、もう少しシンプルなデザインにしたい場合があります。
シンプルにする
Radar Chart の Document を読みます。
Radar Chart のデフォルトリンク先が異なるプロットである ScatterPlot であるため、以下の Ploar のドキュメントも使うと良いです。
import plotly.graph_objects as go
fig = go.Figure()

fig.add_trace(
 go.Scatterpolar(
  fill="none",
  name=f"Cluster{i}",
  opacity=0.7,
  line=dict(width=5),
 )
)
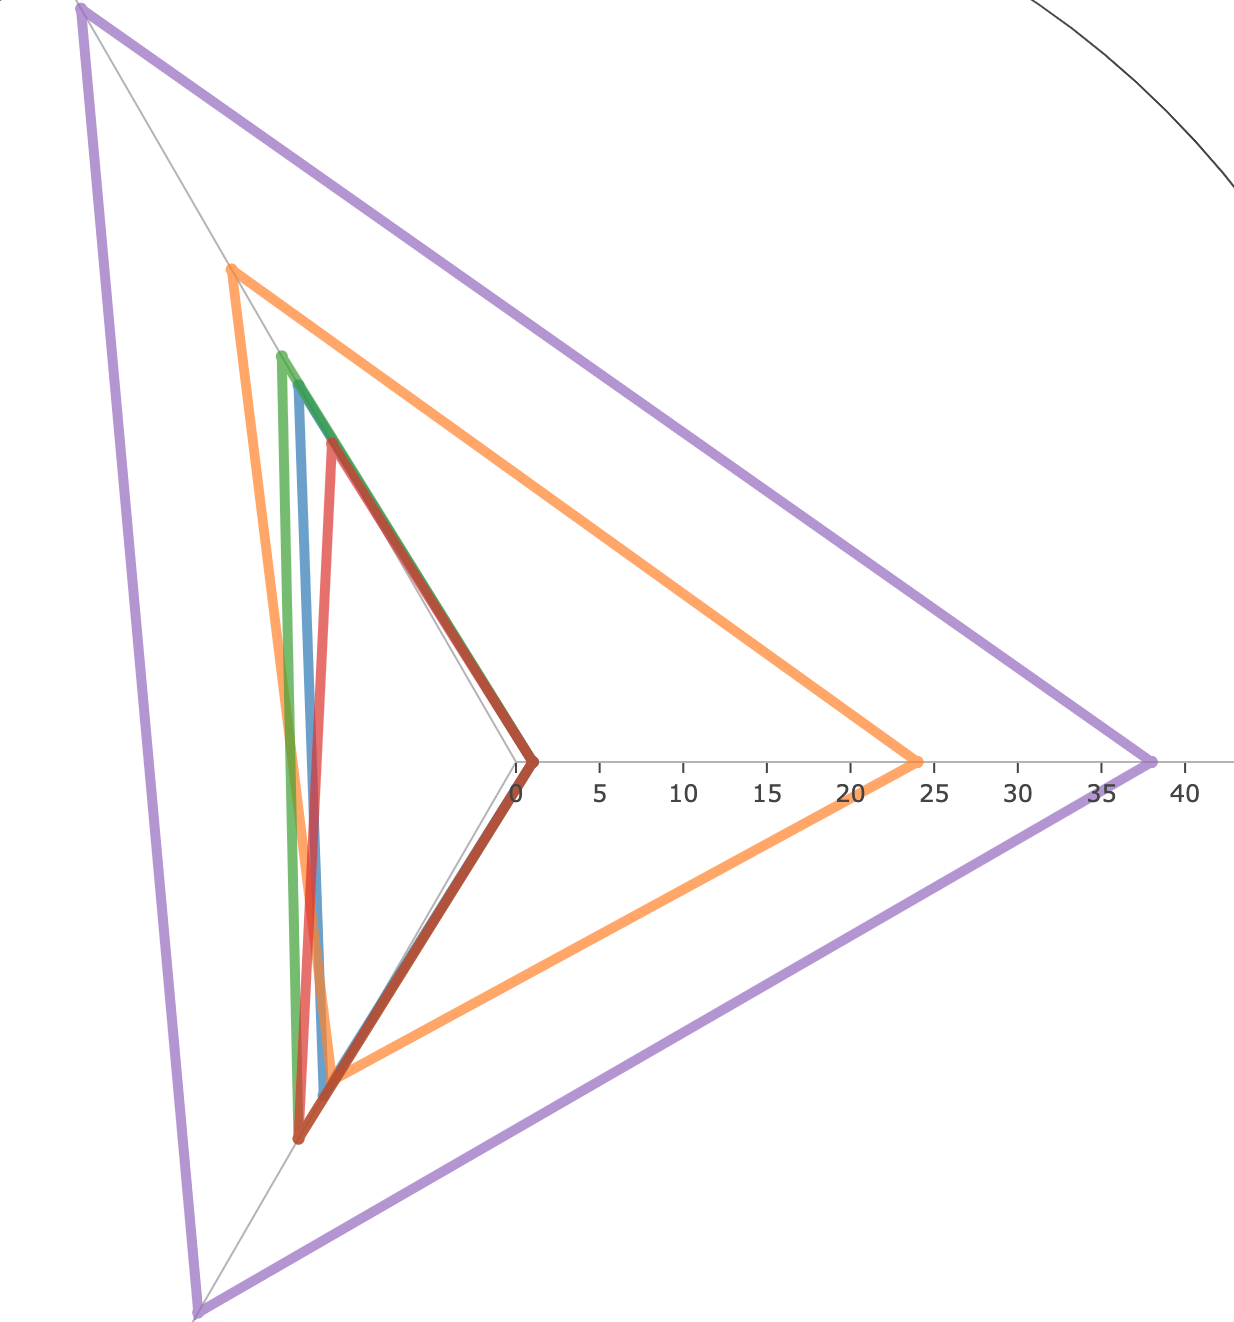
fill を "none" に設定しておくと、描画される各 Radar が線のみで描画されてうれしいです。
fig.update_layout(
    template=None,
    polar=dict(
        radialaxis=dict(
        visible=True,
        range=[0, max_axis_value],
        showline=False,
        showgrid=False,
    ),
    angularaxis=dict(tickfont=dict(size=30)),
    paper_bgcolor="rgb(255, 255, 255)",
    plot_bgcolor="rgb(255, 255, 255)",
)
template を None にするとデザインがシンプルになります。
また、 polar に対して、 showline や showgrid の設定を False にするといらない線が描画されなくなります。
Discussion