背景
現在、インターン先で Next.js を使用した開発をしており、その中でチャートを作成する機会がありました。
また、いくつかチャートライブラリは存在するものの実務で使えそうなものを探すのに苦労する人がいるのでは?と思い今回、本記事を書きました。
デザインやカスタマイズ性、使いやすさを考慮しておすすめな React 製チャートライブラリ 5 選を紹介します。
なお、サンプルコードは開発現場に合わせて Next.js(App Router)×Typescript で載せています。
比較
React Charts
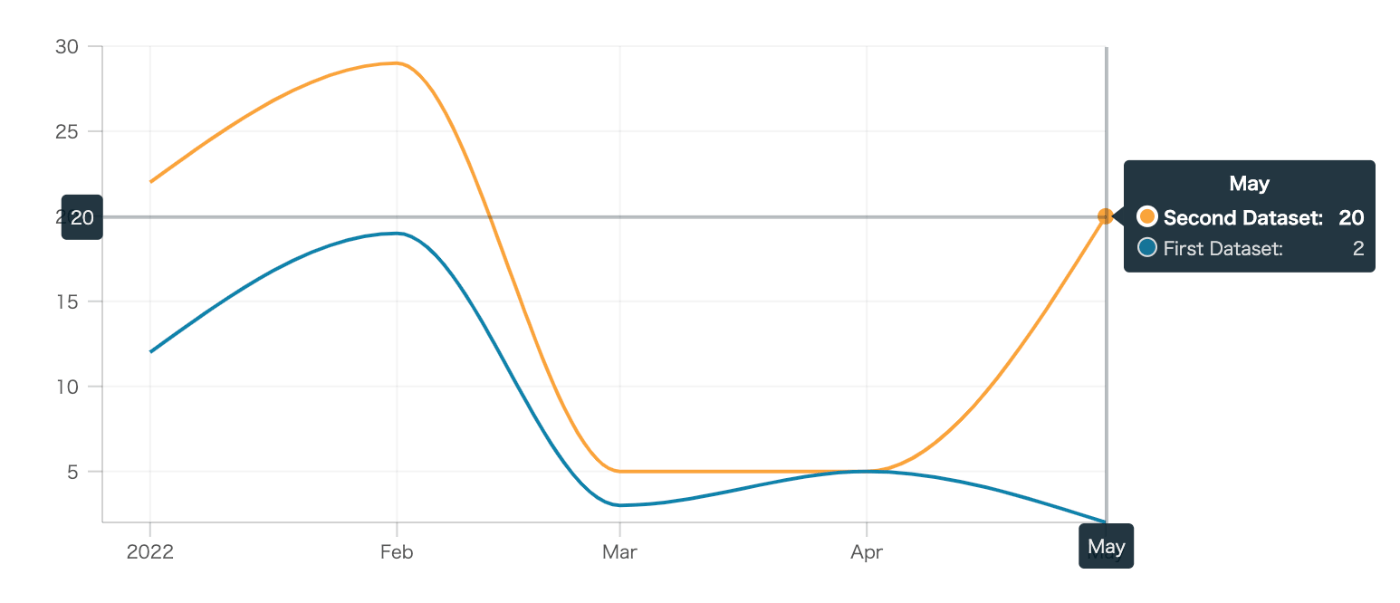
マルチラインチャートのコード
// yarn add react-charts@beta
"use client";
import React from "react";
import { Chart, AxisOptions } from "react-charts";

type DailyStars = {
  date: Date,
  stars: number,
};

type Series = {
  label: string,
  data: DailyStars[],
};

const data: Series[] = [
  {
    label: "First Dataset",
    data: [
      { date: new Date("2022-01-01"), stars: 12 },
      { date: new Date("2022-02-01"), stars: 19 },
      { date: new Date("2022-03-01"), stars: 3 },
      { date: new Date("2022-04-01"), stars: 5 },
      { date: new Date("2022-05-01"), stars: 2 },
    ],
  },
  {
    label: "Second Dataset",
    data: [
      { date: new Date("2022-01-01"), stars: 22 },
      { date: new Date("2022-02-01"), stars: 29 },
      { date: new Date("2022-03-01"), stars: 5 },
      { date: new Date("2022-04-01"), stars: 5 },
      { date: new Date("2022-05-01"), stars: 20 },
    ],
  },
];

export const MultilineChart = () => {
  const primaryAxis = React.useMemo(
    (): AxisOptions<DailyStars> => ({
      getValue: (datum) => datum.date,
    }),
    []
  );

  const secondaryAxes = React.useMemo(
    (): AxisOptions<DailyStars>[] => [
      {
        getValue: (datum) => datum.stars,
      },
    ],
    []
  );

  return (
    <div style={{ width: "600px", height: "300px" }}>
      <Chart
        options={{
          data,
          primaryAxis,
          secondaryAxes,
        }}
      />
    </div>
  );
};
特徴
一般的に 2 つのチャートのポイントが縦軸同じであれば 2 つのポイントにフォーカスが当たる一方で、こちらは 1 つ 1 つの点にフォーカスが当たるのでそこが他のライブラリにはない魅力です。また、useMemo が使えるので、パフォーマンス重視であればおすすめです。
一方デフォルトでは、ラベルを押すなどしてチャートの表示・非表示する機能は提供されてないようです。他にもレスポンシブ対応するようなコンポーネントは用意されておらず div で囲って対応する必要があります。
チャートライブラリのドキュメントの example がクラスコンポーネントが多い中で、これは関数コンポーネントなので、使う側としてはありがたいです。ただドキュメントに関していうと、他と比べてそこまで充実していない印象です。
チャートの種類:約 12 種類
LineChart, BarChart, Bar (Stacked)Chart, Bar (Horizontal)Chart, Bar (Horizontal + Stacked), BandChart, AreaChart, BubbleChart, SteamChart, Spark Chart, Multiple Axes, Interaction Modes
最終リリース:2020 年 5 月 30 日
週間ダウンロード数:18,138
Github star 数:2,592
Victory
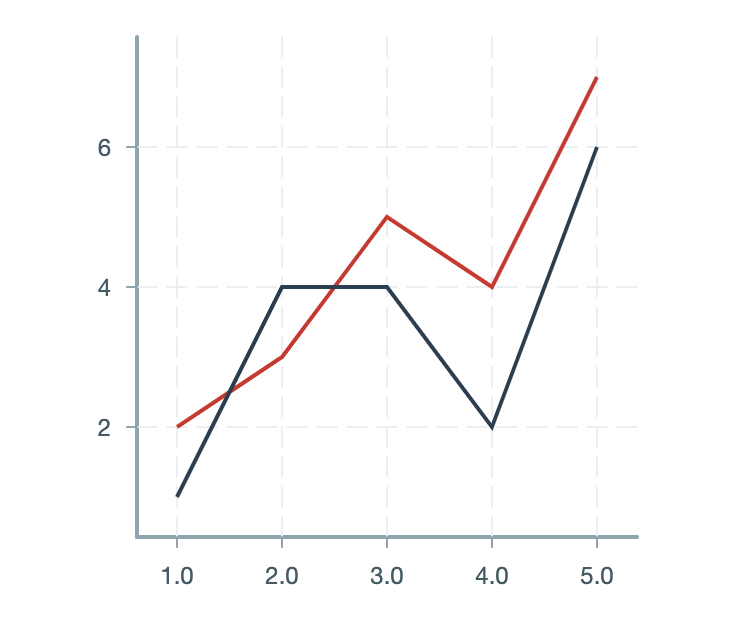
マルチラインチャートのコード
// yarn add victory
"use client";
import React from "react";
import { VictoryChart, VictoryLine, VictoryAxis, VictoryTheme } from "victory";

export const MultiLineChart = () => {
  const dataA = [
    { x: 1, y: 2 },
    { x: 2, y: 3 },
    { x: 3, y: 5 },
    { x: 4, y: 4 },
    { x: 5, y: 7 },
  ];

  const dataB = [
    { x: 1, y: 1 },
    { x: 2, y: 4 },
    { x: 3, y: 4 },
    { x: 4, y: 2 },
    { x: 5, y: 6 },
  ];

  return (
    <div>
      <VictoryChart theme={VictoryTheme.material} domainPadding={20}>
        <VictoryAxis />
        <VictoryAxis dependentAxis />
        <VictoryLine data={dataA} style={{ data: { stroke: "#c43a31" } }} />
        <VictoryLine data={dataB} style={{ data: { stroke: "#2c3e50" } }} />
      </VictoryChart>
    </div>
  );
};
特徴
コンポーネントを組み合わせることでチャートができます(Recharts に似ている)。デフォルトで tooltip が提供されていないので、チャートにフォーカスを当てても詳細が表示されなかったです(カスタマイズすれば追加できる)。各チャートで拡張できるものを網羅的に公式ドキュメントにまとまっているため、高度な設定を必要とする場合はおすすめです。
チャートの種類:約 15 種類
VictoryBoxPlot / VictoryArea / VictoryAxis / VictoryBar / VictoryCandlestick / VictoryChart / VictoryErrorBar / VictoryGroup / VictoryLine / VictoryPie / VictoryPolarAxis / VictoryScatter / VictoryStack / VictoryVoronoi / VictoryHistogram
最終リリース:2022 年 8 月 5 日
週間ダウンロード数:199,854
Github star 数:10,461
React-chartjs-2
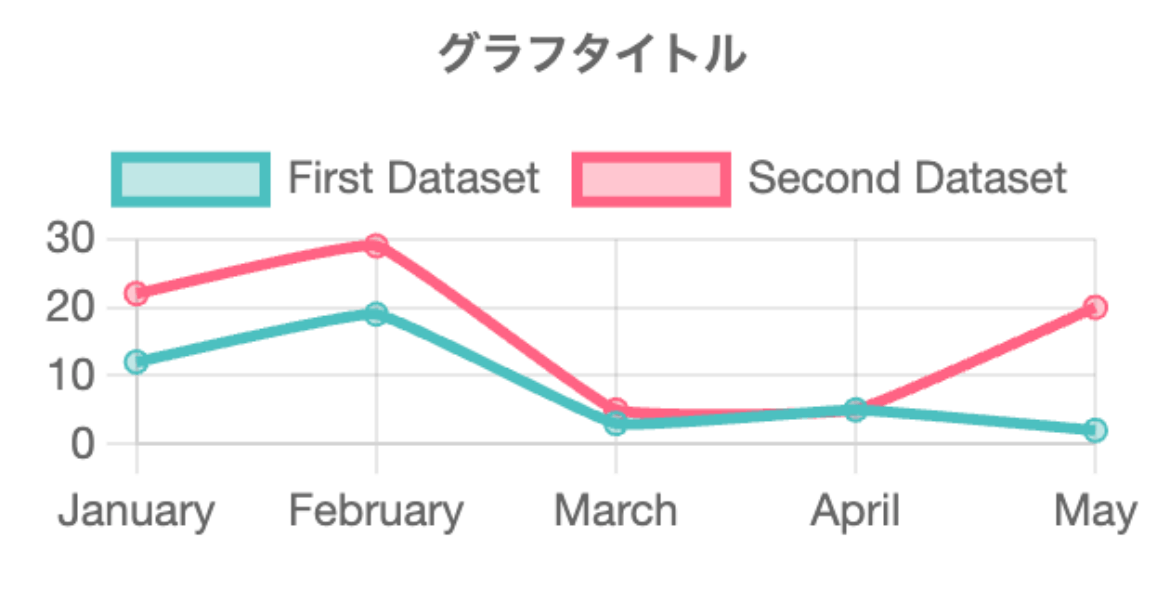
マルチラインチャートのコード
// yarn add chart.js react-chartjs-2
"use client";
import { Line } from "react-chartjs-2";
import {
  Chart as ChartJS,
  CategoryScale,
  LinearScale,
  PointElement,
  LineElement,
  Title,
  Tooltip,
  Legend,
} from "chart.js";

ChartJS.register(
  CategoryScale,
  LinearScale,
  PointElement,
  LineElement,
  Title,
  Tooltip,
  Legend
);

export const MultiLineChart = () => {
  const options = {
    responsive: true,
    plugins: {
      title: {
        display: true,
        text: "グラフタイトル",
      },
    },
  };
  const data = {
    labels: ["January", "February", "March", "April", "May"],
    datasets: [
      {
        label: "First Dataset",
        data: [12, 19, 3, 5, 2],
        fill: false,
        backgroundColor: "rgba(75,192,192,0.4)",
        borderColor: "rgba(75,192,192,1)",
        tension: 0.1,
      },
      {
        label: "Second Dataset",
        data: [22, 29, 5, 5, 20],
        fill: false,
        backgroundColor: "rgba(255,99,132,0.4)",
        borderColor: "rgba(255,99,132,1)",
        tension: 0.1,
      },
    ],
  };

  return <Line data={data} options={options} />;
};
特徴
datasets で、各チャート毎にスタイルを指定できたり、拡張性が高く扱いやすいです。
ラベルを押すと、そのチャートが表示・非表示されるようになっています。
また、その際アニメーションが有効になっており、トランジションがおしゃれだなと感じました。
ただ使用時に、インポートするものが多いのとチャート内で使用するものを register に登録しておく必要があるのが欠点だなと思いました。
チャートの種類:約 17 種類
Vertical Bar Chart / Horizontal Bar Chart / Stacked Bar Chart / Grouped Bar Chart / Area Chart / Line Chart / Multiaxis Line Chart / Pie Chart / Doughnut Chart / Polar Area Chart / Radar Chart / Scatter Chart / Bubble Chart / Multitype Chart / Chart Events / Get Chart Ref / Gradient Chart
最終リリース:2023 年 1 月 10 日
週間ダウンロード数:949,021
Github star 数:6,067
Recharts

マルチラインチャートのコード
// yarn add recharts
import React from "react";
import {
  LineChart,
  Line,
  XAxis,
  YAxis,
  CartesianGrid,
  Tooltip,
  Legend,
} from "recharts";
const data = [
  { name: "Page A", uv: 4000, pv: 2400, amt: 2400 },
  { name: "Page B", uv: 3000, pv: 1398, amt: 2210 },
  { name: "Page C", uv: 2000, pv: 9800, amt: 2290 },
  { name: "Page D", uv: 2780, pv: 3908, amt: 2000 },
  { name: "Page E", uv: 1890, pv: 4800, amt: 2181 },
  { name: "Page F", uv: 2390, pv: 3800, amt: 2500 },
  { name: "Page G", uv: 3490, pv: 4300, amt: 2100 },
];

export const MultiLineChart = () => {
  return (
    <LineChart
      width={500}
      height={300}
      data={data}
      margin={{
        top: 5,
        right: 30,
        left: 20,
        bottom: 5,
      }}
    >
      <CartesianGrid strokeDasharray="3 3" />
      <XAxis dataKey="name" />
      <YAxis />
      <Tooltip />
      <Legend />
      <Line
        type="monotone"
        dataKey="pv"
        stroke="#8884d8"
        activeDot={{ r: 8 }}
      />
      <Line type="monotone" dataKey="uv" stroke="#82ca9d" />
    </LineChart>
  );
};
特徴
必要な要素をコンポーネント毎に組み合わせてチャートが出来上がるため、細かな設定がしやすいです。特に、ラインの追加はコンポーネントを追加するだけなので使いやすいです。チャートの種類もめちゃくちゃ多いので、安定にして王道って感じですね。
カスタマイズ要素も多いので、実務向きだと思います。
チャートの種類:約 65 種類
LineChart(16 種類) / AreaChart(8 種類) / BarChart(14 種類) / ComposedChart(5 種類) / ScatterChart(7 種類) / RaderChart(2 種類) / RadialBarChart(1 種類) / TreeMap(2 種類)/ etc..
最終リリース:2023 年 8 月 9 日
週間ダウロード数:1,252,836
Github star 数:20,858
Ant Design Charts
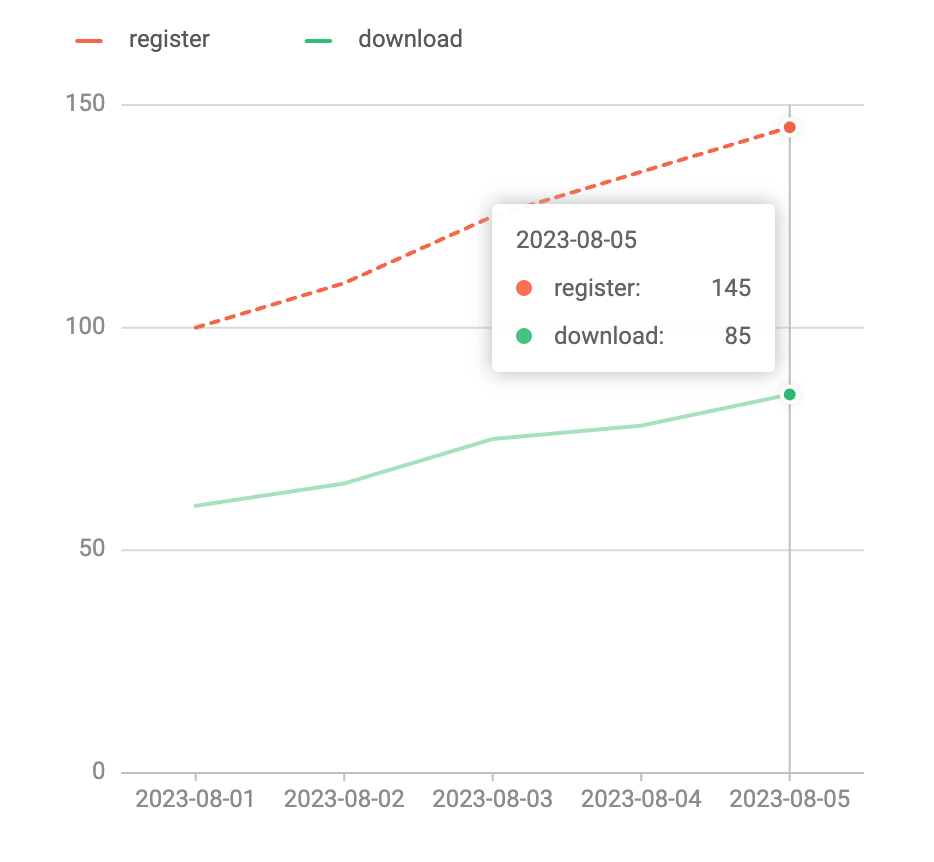
マルチラインチャートのコード
// yarn add @ant-design/plots
"use client";
import { Line } from "@ant-design/plots";
type DataPoint = {
  date: string,
  value: number,
  type: string,
};
export const MultiLineChart = () => {
  // Mock data
  const data: DataPoint[] = [
    // type register
    { date: "2023-08-01", value: 100, type: "register" },
    { date: "2023-08-02", value: 110, type: "register" },
    { date: "2023-08-03", value: 125, type: "register" },
    { date: "2023-08-04", value: 135, type: "register" },
    { date: "2023-08-05", value: 145, type: "register" },
    // type download
    { date: "2023-08-01", value: 60, type: "download" },
    { date: "2023-08-02", value: 65, type: "download" },
    { date: "2023-08-03", value: 75, type: "download" },
    { date: "2023-08-04", value: 78, type: "download" },
    { date: "2023-08-05", value: 85, type: "download" },
  ];

  const config = {
    data,
    xField: "date",
    yField: "value",
    yAxis: {
      label: {
        formatter: (v: any) =>
          `${v}`.replace(/\d{1,3}(?=(\d{3})+$)/g, (s) => `${s},`),
      },
    },
    seriesField: "type",
    color: ({ type }: Partial<DataPoint>) => {
      if (type === "register") return "#F4664A";
      if (type === "download") return "#30BF78";
      return "#FAAD14";
    },
    lineStyle: ({ type }: DataPoint) => {
      if (type === "register") {
        return {
          lineDash: [4, 4],
          opacity: 1,
        };
      }
      return {
        opacity: 0.5,
      };
    },
  };

  return <Line {...config} />;
};
特徴
config 内でチャートの詳細な設定が行えます。条件に応じて lineStyle を変えたり、ラベルを押すことで、各チャートの表示・非表示ができるので比較の際に便利です。また tooltip の情報やスタイルも変えられるので、カスタマイズ性は非常に高いです。公式ドキュメントは中国語ですが、英訳もあり総合的に見て一番使いやすいです。とにかく、チャートの種類が豊富でかつ、ビジュアルも良いので一般向けのプロダクトには是非導入すべきチャートライブラリです。
チャートの種類:70 種類以上
Flowchart(1 種類) / Relation Graph(8 種類) / LineChart(3 種類) / Area(3 種類) / Column(5 種類) / Bar(5 種類) / Pie(2 種類) / Dual Axes(5 種類) / Progress Plots(3 種類) / Scatter and Bubble(2 種類) / Rose(3 種類) / Relation Plots(2 種類) / Heatmap(2 種類) / Tiny Plots(5 種類)
*他にもありましたが、細かいので省略します。
最終リリース:2022 年 7 月 19 日
週間ダウンロード数:62,628
Github star 数:1,598
まとめ
表にまとめると以下のようになります。
| チャートの種類 | 最終リリース | 週間ダウンロード数 | Github star 数 | |
|---|---|---|---|---|
| React Charts | 約 12 種類 | 2020 年 5 月 30 日 | 18,138 | 2,592 |
| Victory | 約 15 種類 | 2022 年 8 月 5 日 | 199,854 | 10,461 |
| React-chartjs-2 | 約 17 種類 | 2023 年 1 月 10 日 | 949,021 | 6,067 |
| Recharts | 約 65 種類 | 2023 年 8 月 9 日 | 1,252,836 | 20,858 |
| Ant Design Charts | 約 70 種類以上 | 2022 年 7 月 19 日 | 10,461 | 1,598 |
ランキングは以下のようになります。
チャートの種類
- Ant Design Charts
- Recharts
- React-chartjs-2
最終リリース日
- Recharts
- React-chartjs-2
- Victory
週間ダウンロード数
- Recharts
- React-chartjs-2
- Victory
Github star 数
- Recharts
- Victory
- React-chartjs-2
種類の比較
| Recharts | React-chartjs-2 | React Charts | Victory | Ant Design Charts | |
|---|---|---|---|---|---|
| Line | ⚪︎ | ⚪︎ | ⚪︎ | ⚪︎ | ⚪︎ |
| Bar | ⚪︎ | ⚪︎ | ⚪︎ | ⚪︎ | ⚪︎ |
| Area | ⚪︎ | ⚪︎ | ⚪︎ | ⚪︎ | ⚪︎ |
| Sankey | ⚪︎ | - | - | - | ⚪︎ |
| Funnel | ⚪︎ | - | - | - | ⚪︎ |
| Pie | ⚪︎ | ⚪︎ | - | ⚪︎ | ⚪︎ |
| Radial Bar | ⚪︎ | - | - | ⚪︎ | ⚪︎ |
| Radar | ⚪︎ | ⚪︎ | - | ⚪︎ | ⚪︎ |
| Polar Area | - | ⚪︎ | - | ⚪︎ | ⚪︎ |
| Scatter | ⚪︎ | ⚪︎ | - | ⚪︎ | ⚪︎ |
| Bubble | ⚪︎ | ⚪︎ | ⚪︎ | ⚪︎ | ⚪︎ |
| Bullet | - | - | - | - | ⚪︎ |
| Gantt | - | - | - | - | - |
| Histogram | - | - | - | ⚪︎ | ⚪︎ |
| Box Plot | - | - | - | ⚪︎ | ⚪︎ |
| Candlestick | - | - | - | - | ⚪︎ |
| Heatmap | - | - | - | - | ⚪︎ |
| Treemap | ⚪︎ | - | - | - | ⚪︎ |
| Org Chart | - | - | - | - | ⚪︎ |
| Gauge | - | - | - | - | ⚪︎ |
| Geo Chart | - | - | - | - | ⚪︎ |
| Flow Chart/Graph | - | - | - | - | ⚪︎ |
まとめてみると、 Recharts が一番使われている印象ですね。また、種類に関して言うと Ant Design Charts が圧倒的に多いですね。
弊社でも、ビジュアルと種類の豊富さから Ant Design Charts を採用しています。一方で、まだ認知度が低く具体的な使い方に関しての記事が少ないので、今後記事を書く予定です。
また気になったライブラリがあれば、ソースコードも貼ってあるので実際に触ってみて頂ければと思います!
今後のチャートライブラリ選びの参考にして頂ければ幸いです。

フィシルコムのテックブログです。マーケティングSaaSを開発しています。 マイクロサービス・AWS・NextJS・Golang・GraphQLに関する発信が多めです。 カジュアル面談はこちら(ficilcom.notion.site/bbceed45c3e8471691ee4076250cd4b1)から
Discussion