🎉
Python × Twitter API 検索 && 複合グラフ表示
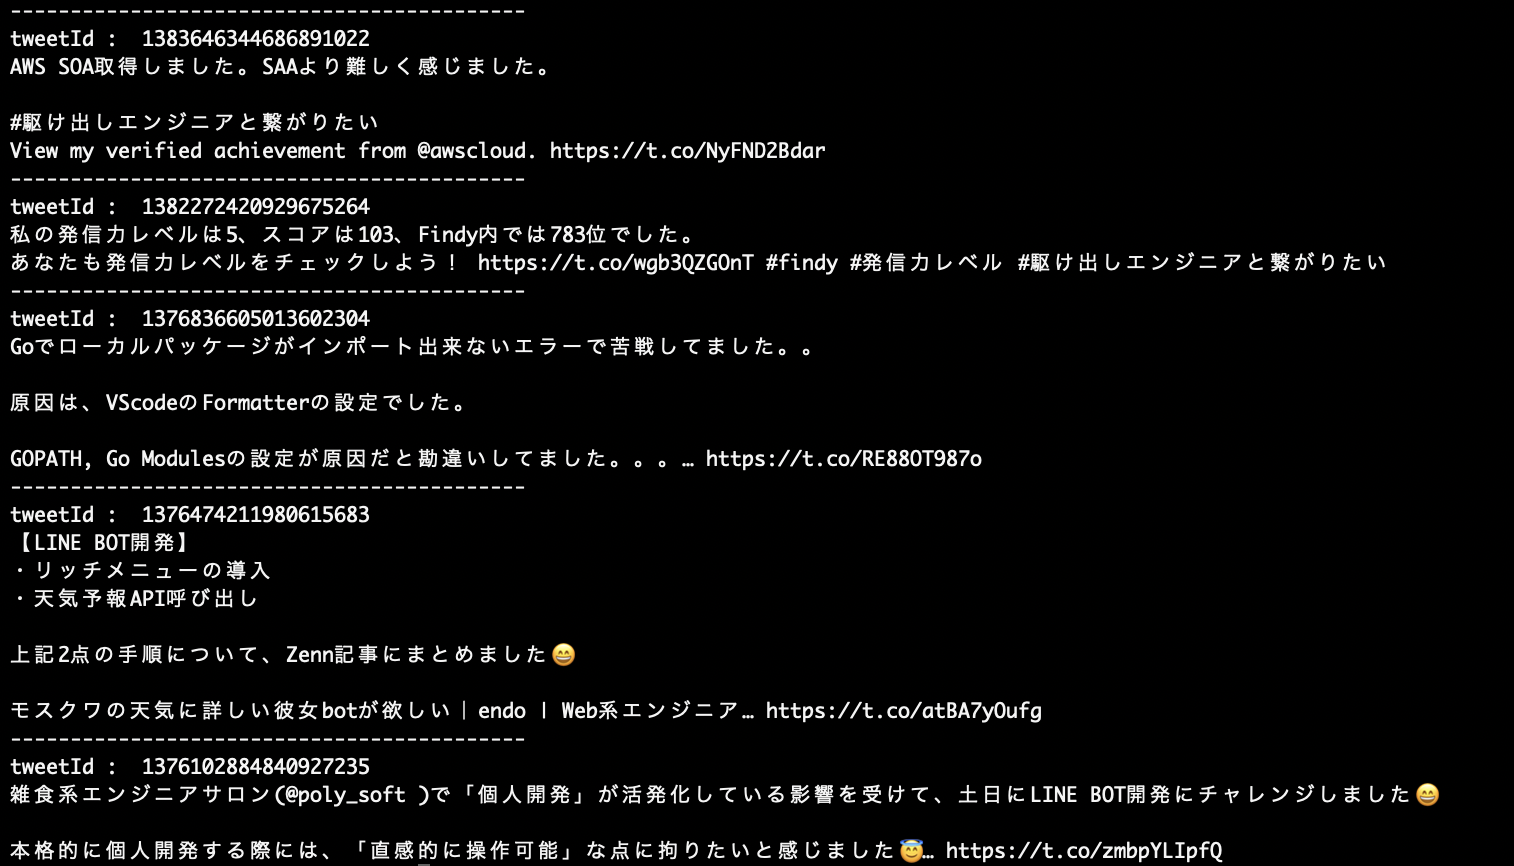
特定ユーザのツイート5件
import tweepy

consumer_key = ""
consumer_secret = ""
access_token = ""
access_token_secret = ""

auth = tweepy.OAuthHandler(consumer_key, consumer_secret)
auth.set_access_token(access_token, access_token_secret)
api = tweepy.API(auth)

# 特定のユーザー
Account = "non_0131"
tweets = api.user_timeline(Account, count=5)
for tweet in tweets:
    print('-------------------------------------------')
    print('tweetId : ', tweet.id)
    print(tweet.text)
実行結果
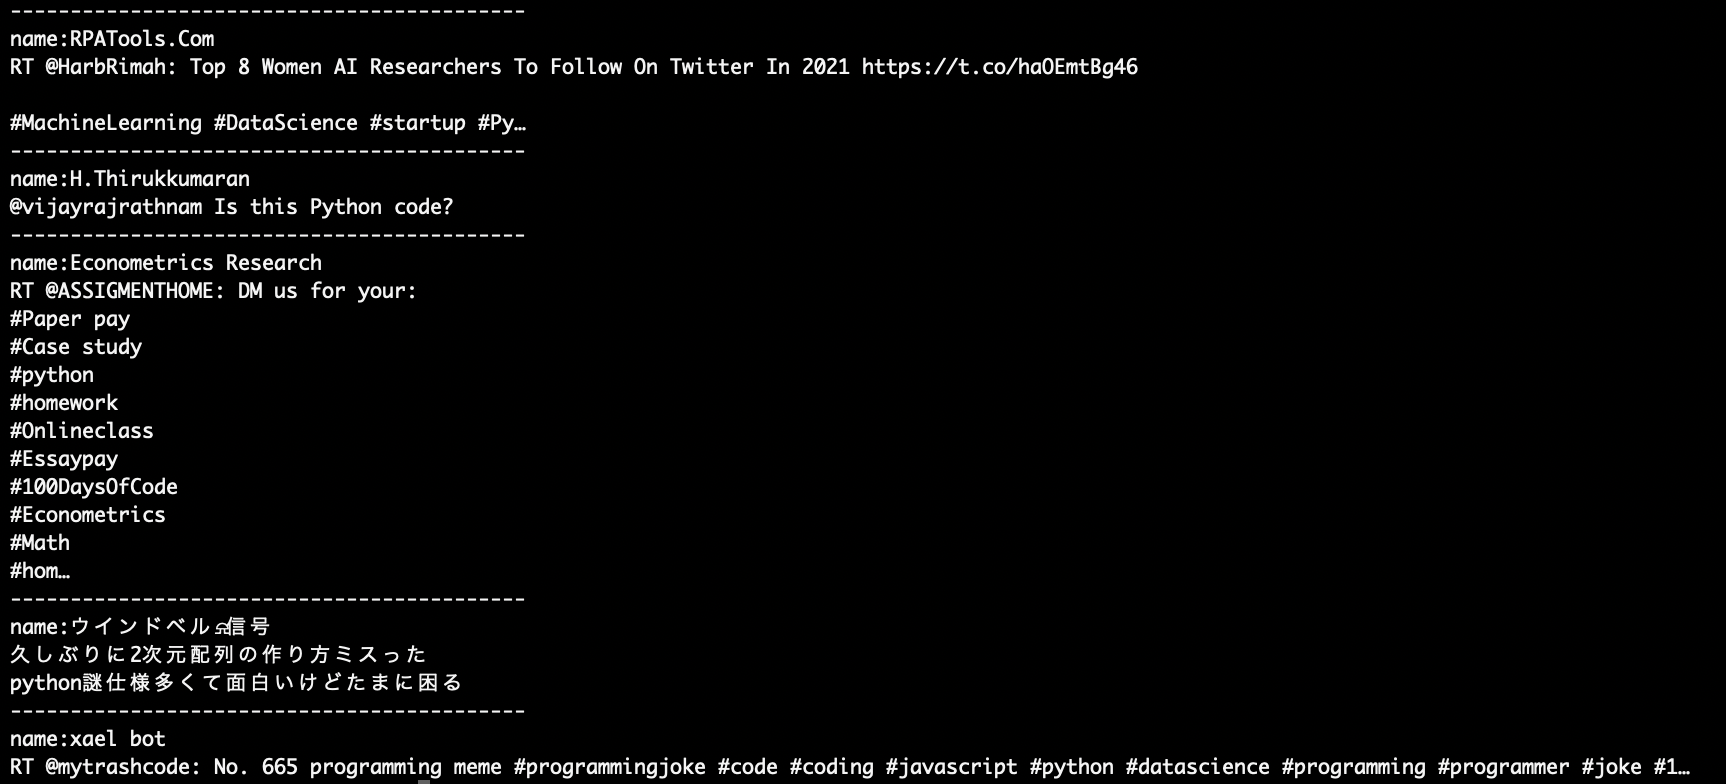
キーワード検索 5件
import tweepy

consumer_key = ""
consumer_secret = ""
access_token = ""
access_token_secret = ""

auth = tweepy.OAuthHandler(consumer_key, consumer_secret)
auth.set_access_token(access_token, access_token_secret)
api = tweepy.API(auth)

keyword = 'Python'

# キーワード検索
for tweet in api.search(q=keyword, count=5):
    print('-------------------------------------------')
    print('name:' + tweet.user.name)
    print(tweet.text)
実行結果
特定のキーワードを含むツイート件数
import tweepy

consumer_key = ""
consumer_secret = ""
access_token = ""
access_token_secret = ""

auth = tweepy.OAuthHandler(consumer_key, consumer_secret)
auth.set_access_token(access_token, access_token_secret)
api = tweepy.API(auth)

# ツイート件数 ※最大10件まで
keyword = '五反田'
tweets_data = []

for tweet in tweepy.Cursor(
    api.search,
    q=keyword,
    tweet_mode='extended',
        lang='ja').items(10):
    tweets_data.append(tweet.full_text.strip().replace('\n', '。') + '\n')

print(len(tweets_data))
実行結果

特定のキーワードを含むツイート件数(期間指定)
import tweepy

consumer_key = ""
consumer_secret = ""
access_token = ""
access_token_secret = ""

auth = tweepy.OAuthHandler(consumer_key, consumer_secret)
auth.set_access_token(access_token, access_token_secret)
api = tweepy.API(auth)

tweets_data = []
keyword = '五反田'
since = "2021-04-23 00:00:00"
until = "2021-04-24 00:00:00"

for tweet in tweepy.Cursor(api.search,
                           q=keyword,
                           tweet_mode='extended',
                           lang='ja',
                           since=since,
                           until=until).items():
    tweets_data.append(tweet.full_text.strip().replace(
        '\n', '。') + '\n')

print(len(tweets_data))
実行結果

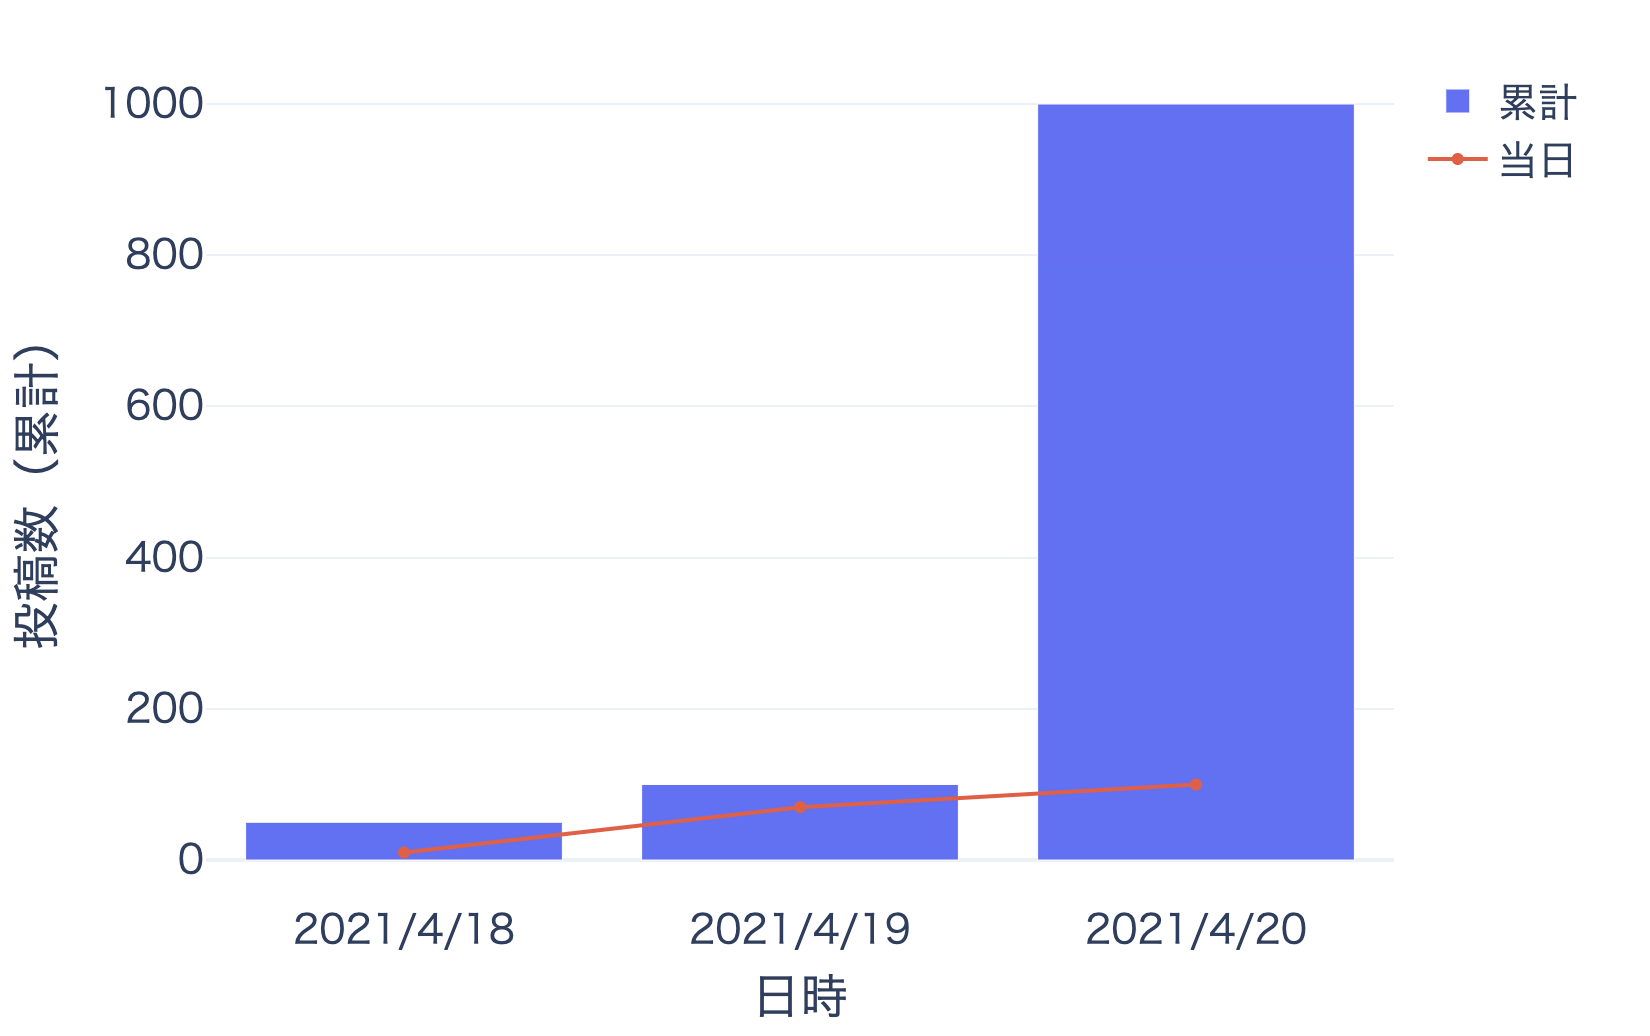
Plotly 複合グラフ表示
import plotly.graph_objects as go

fig = go.Figure()
X = ["2021/4/18", "2021/4/19", "2021/4/20"]
Y = [50, 100, 1000]
Z = [10, 70, 100]

fig.add_trace(go.Bar(x=X, y=Y, name="累計"))

fig.add_trace(go.Scatter(x=X, y=Z, name="当日"))

fig.update_xaxes(title="日時")
fig.update_yaxes(title="投稿数(累計)")
fig.update_layout(font={"family": "Meiryo", "size": 20})
fig.update_layout(showlegend=True)
fig.update_layout(width=800, height=600)
fig.update_layout(template="plotly_white")
fig.show()
実行結果
Discussion