はじめに
Commune Developers Advent Calendar 2025の10日目は、OpenTelemetryのトレースをLaunchDarklyへ送るだけで自動ロールバック付きのカナリアリリースができるので検証してみたという記事です。以降OpenTelemetryはOTel、LaunchDarklyはLDと略します。
Guarded rollouts
LDのGuarded rolloutsという機能を使って検証します。
簡単にいうと問題がなければ徐々にリリースし問題があれば戻す機能です。通常はリリース後の監視や切り戻す際のオペレーションが必要ですが、これを自動化できます。
判定に使うメトリクス
リリースを続けるか戻すかは何かしらの判断が必要です。LDにはOTelのトレースデータからメトリクスを自動生成する機能があり、これを判断に使えます。すでにLDとOTel導入済みならOTel Collectorのトレースのエクスポート先へLDを追加するだけで生成されます。
動作検証
今回はリリース後に問題が発生して自動ロールバックする検証を行いました。
LaunchDarkly SDKの設定
LDはフィーチャーフラグのサービスというイメージどおり今回の検証でもそれを使います。
フィーチャーフラグに関する情報をOTelのスパンへ追加するための設定を行います。以下はNode.jsの設定例です。
import { LDOptions, init } from '@launchdarkly/node-server-sdk';
import { TracingHook } from '@launchdarkly/node-server-sdk-otel';

const options: LDOptions = {
	hooks: [new TracingHook()]
}

const client = init('YOUR_SDK_KEY', options);
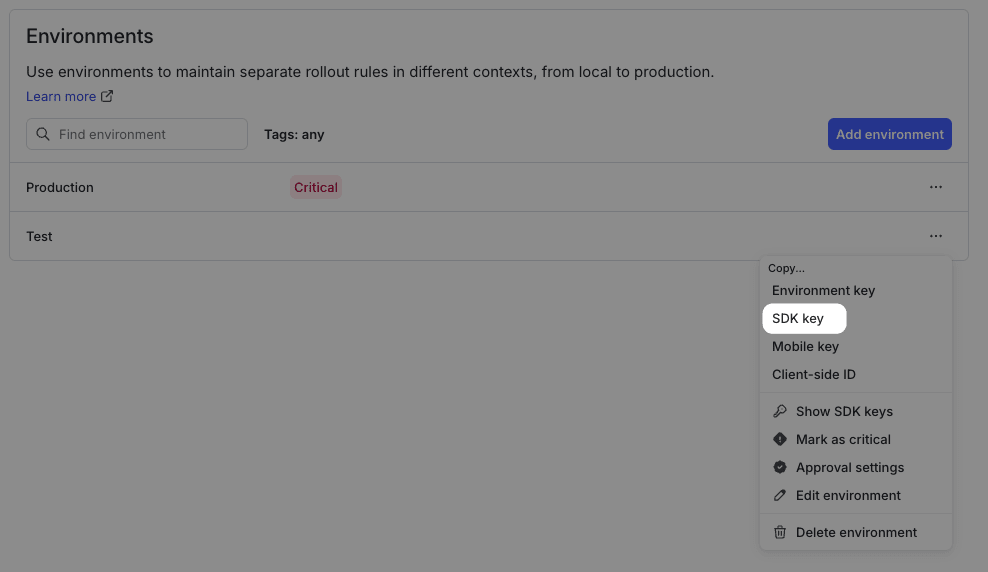
YOUR_SDK_KEYの値はLDのUIのProject settings > Environments > SDK keyから取得できます。Secret Managerなどへ保管して参照します。
ドキュメントによるとこの設定で以下が行われるようです。
The OpenTelemetry tracing hook automatically attaches feature flag event data to your OTel traces for you.
その他の言語のSDKや詳細な設定方法はServer-side SDKsを参照ください。
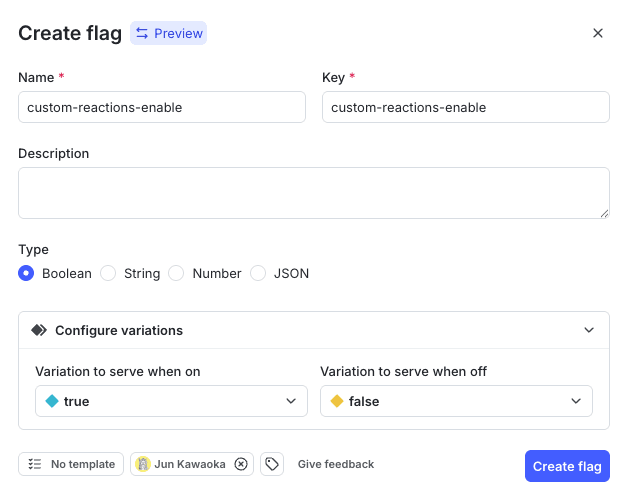
フィーチャーフラグの作成
Releases > Flagsからフィーチャーフラグを作成します。今回はトグルON/OFFするだけの検証なのでTypeをBooleanにしました。
アプリケーションの実装
以下のようにトグルONの時の処理を実装します。
// フィーチャーフラグの評価
const newFeatureEnabled = await ldClient.variation('custom-reactions-enable', context, false)

if (newFeatureEnabled) {
  // トグルONの時の処理
}
今回はトグルONの時にHTTP500エラーが発生するようにしました。
OpenTelemetryの設定
OTelのトレースをLDへ送信します。OTelのSDKから直接あるいはOTel Collector経由でLDへ送信できます。OTel Collectorを利用しているならトレースのエクスポート先へLDを追加すればOKです。
OTel Collectorの設定例(ドキュメントから抜粋)
# The receivers specify how the collector receives data.
# In this example, it receives data using the OpenTelemetry Protocol (OTLP) over gRPC and HTTP.
receivers:
  otlp:
    protocols:
      grpc:
      http:

# The exporters specify how the collector sends data.
exporters:
  otlphttp:
    endpoint: https://otel.observability.app.launchdarkly.com:4318
  otlp:
    endpoint: https://otel.observability.app.launchdarkly.com:4317

# The processors specify how the collector processes the trace data.
# In this example, it groups spans that belong to the same trace,
# and drops spans that aren't needed for guarded rollouts.
processors:

  # This processor sets the resource attribute to your SDK key.
  # If you are using a LaunchDarkly SDK, you do NOT need to include this.
  # If you are using an OpenTelemetry SDK, you do need to set the
  # resource attributes. You can set them here, set them in your application,
  # or set them using an environment variable.
  resource:
    attributes:
        - key: highlight.project_id
          value: YOUR_SDK_KEY
          action: upsert

  # The groupbytrace processor groups all spans that belong to the same trace together.
  # This is required to ensure LaunchDarkly receives a complete trace in a single request.
  groupbytrace:
    wait_duration: 10s

  # This filter drops all span events except for exceptions and feature flag evaluations
  # that were part of an active guarded rollout.
  # It is optional, but useful to limit the amount of data you send to LaunchDarkly.
  filter/launchdarkly-spanevents:
    error_mode: ignore
    traces:
      spanevent:
        - 'not ((name == "feature_flag" and attributes["feature_flag.result.reason.inExperiment"] == true) or name == "exception")'

  # This filter removes all spans that do not have an HTTP route or any span events
  # remaining after the previous filter has been applied
  filter/launchdarkly-spans:
    error_mode: ignore
    traces:
      span:
        - 'not (attributes["http.route"] != nil or Len(events) > 0)'

  batch:

extensions:
  health_check:

service:
  pipelines:
    # Add a new pipeline to send data to LaunchDarkly
    traces/ld:
      receivers: [otlp]
      processors:
        [
          filter/launchdarkly-spanevents,
          filter/launchdarkly-spans,
          groupbytrace,
          batch,
        ]
      exporters: [otlphttp/launchdarkly]
    metrics:
      receivers: [otlp]
      processors: [resource]
      exporters: [otlphttp]
    logs:
      receivers: [otlp]
      processors: [resource]
      exporters: [otlphttp]
詳細はConfiguring the collectorを参照ください。
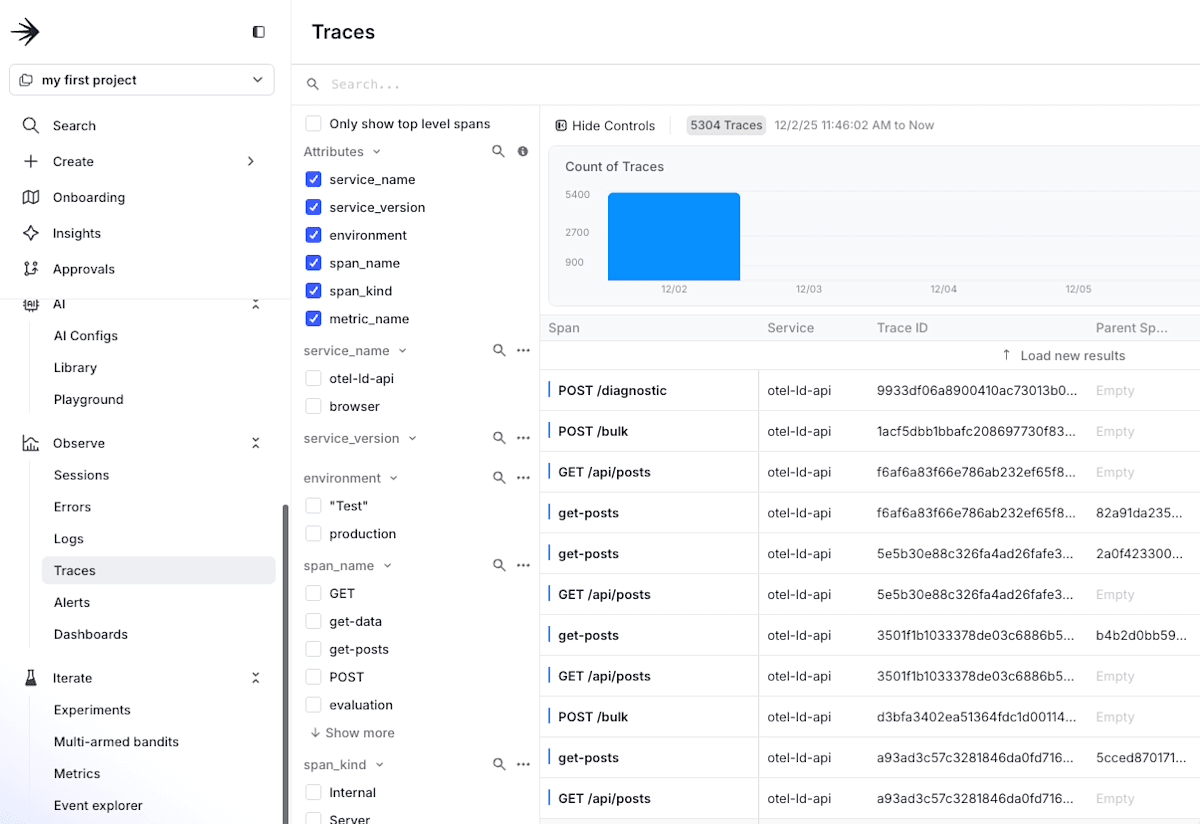
メトリクス生成確認
アプリケーションへリクエストするとLDのObserve > Tracesへトレースが表示されます。
トレースにはfeature_flagの属性があります。
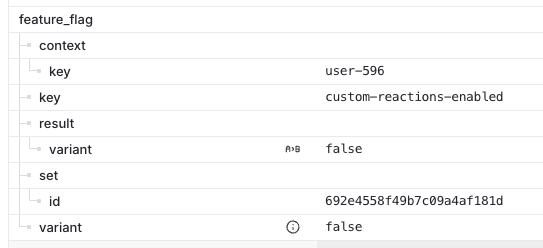
ドキュメントにあるようにfeature_flag.context.keyがないとトレースとみなされないようです。
A feature flag span event is defined as any span event that contains a feature_flag.context.key attribute. LaunchDarkly ignores traces that do not include span events with this attribute.
@launchdarkly/node-server-sdk-otelのTracingHookによってこの属性が追加されるはずです。
Iterate > Metricsにメトリクスが表示されます。これがOTelのトレースから自動生成されたものです。
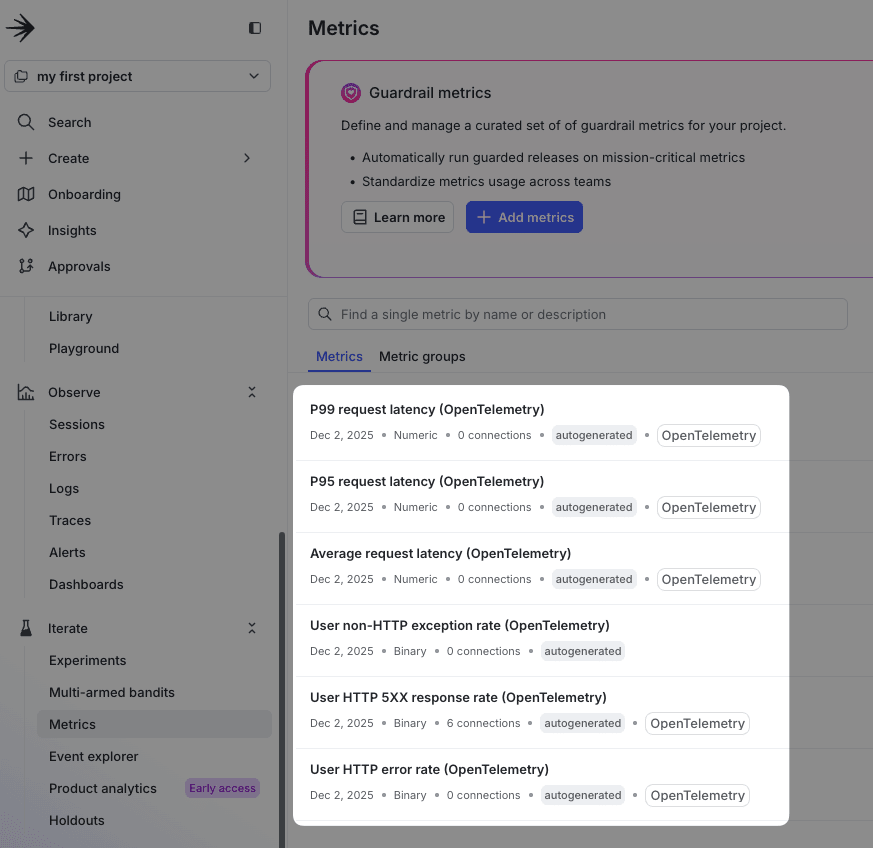
自動生成されるメトリクスの一覧はMetrics autogenerated from OpenTelemetry dataを参照ください。
Guarded rolloutsの設定
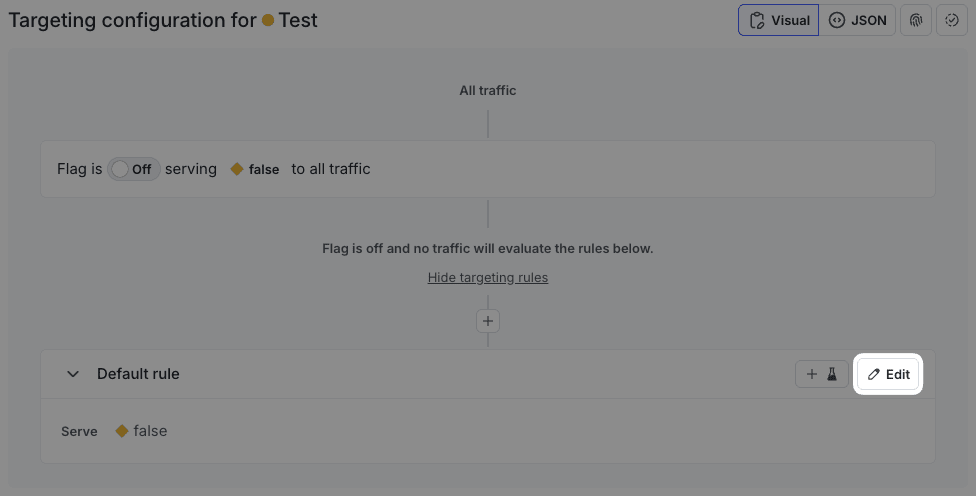
フィーチャーフラグのルールを変更します。Release > Flagsから対象のフラグを選択し、Default ruleのEditをクリックします。
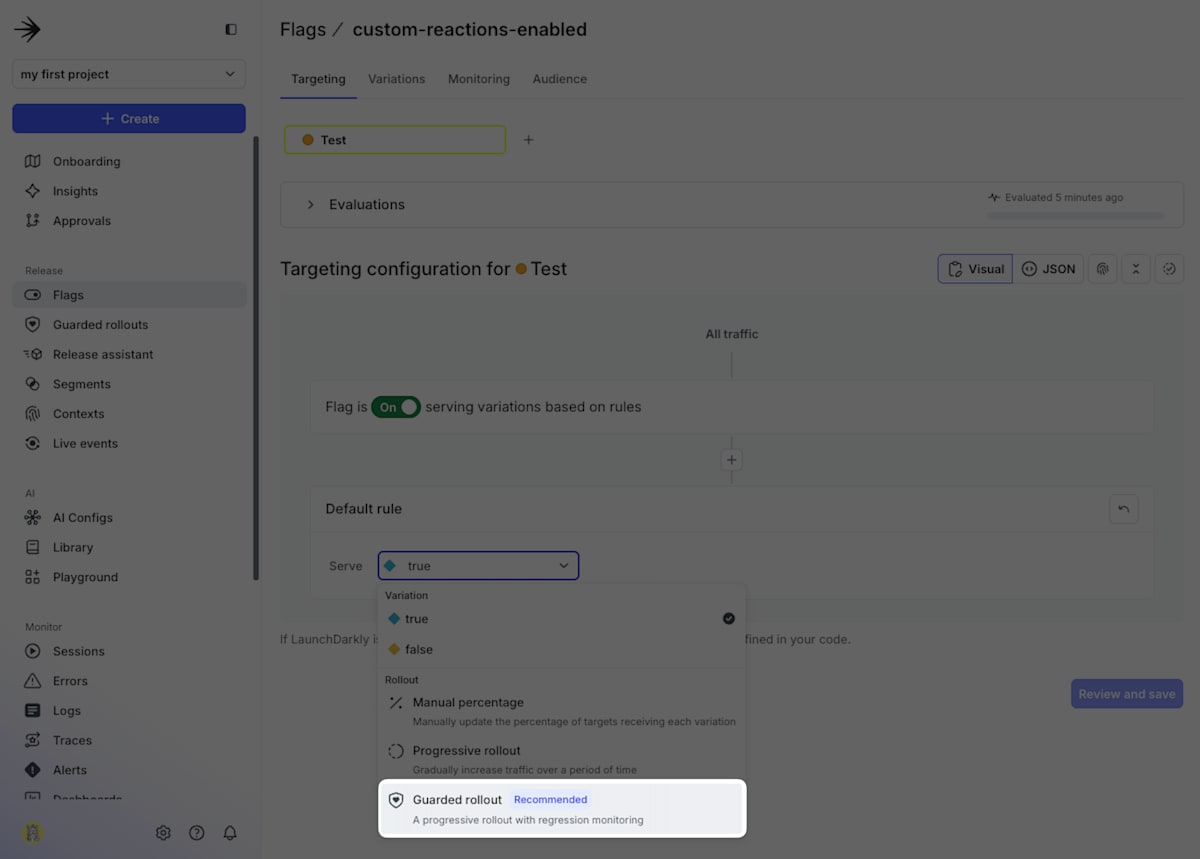
Guarded rolloutを選択します。
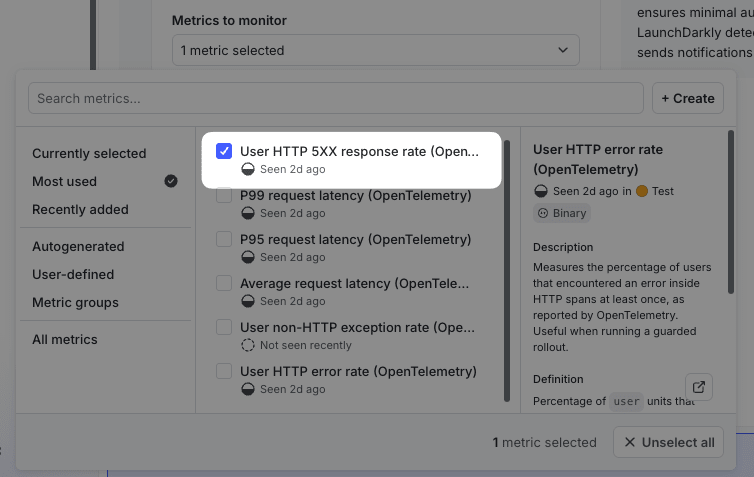
Metrics to monitorでロールアウトロールバックの判断に用いるメトリクスを選択します。OTelのトレースから生成されたHTTP 5XXエラー率のメトリクスを選びました。
自動ロールバックする条件を設定します。5XXエラーの割合を3%に設定しました。
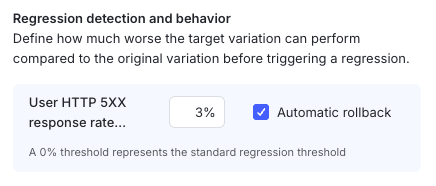
この数値の意味はドキュメントで以下のように説明されています。
if the original variation’s error rate is 5%, a 10% threshold means the new variation’s error rate must exceed 5.5% before it’s flagged as a regression.
リリースによるリグレッションをどの程度許容するかによって値を設定します。詳細はRegression thresholds for guarded rolloutsを参照ください。
最後にロールアウトの期間を設定します。リリース完了までの時間と各ステップのロールアウトの割合を設定します。

今回は検証なので、短くするためにCustomから設定しました。
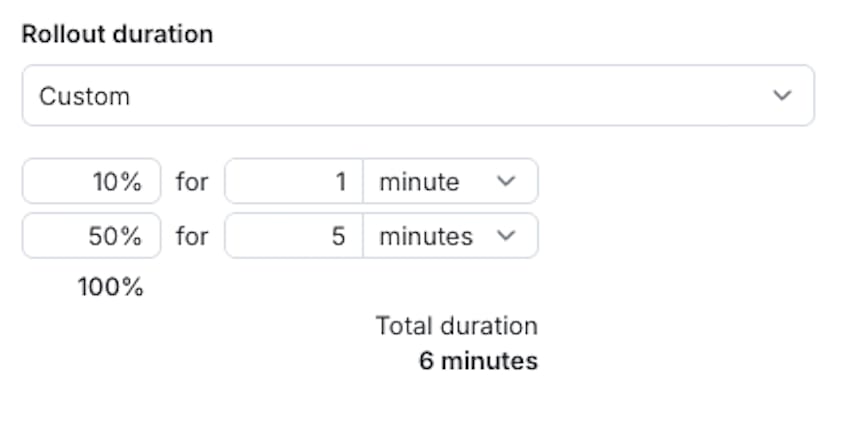
リリース内容に応じてロールアウトの割合と時間を柔軟に決められるので、例えばリリース後すぐに影響を確認したい場合は短期間とし、リリース成功失敗の判断に多くのサンプルが必要だとか、週末を挟んで経過観察がしたいなどの場合は長期間にするのが良いと思います。
自動ロールバックの動作確認
設定を保存するとトグルがONになりリリースが始まります。

しばらくすると500エラーが増え、期待どおり自動ロールバックされました。
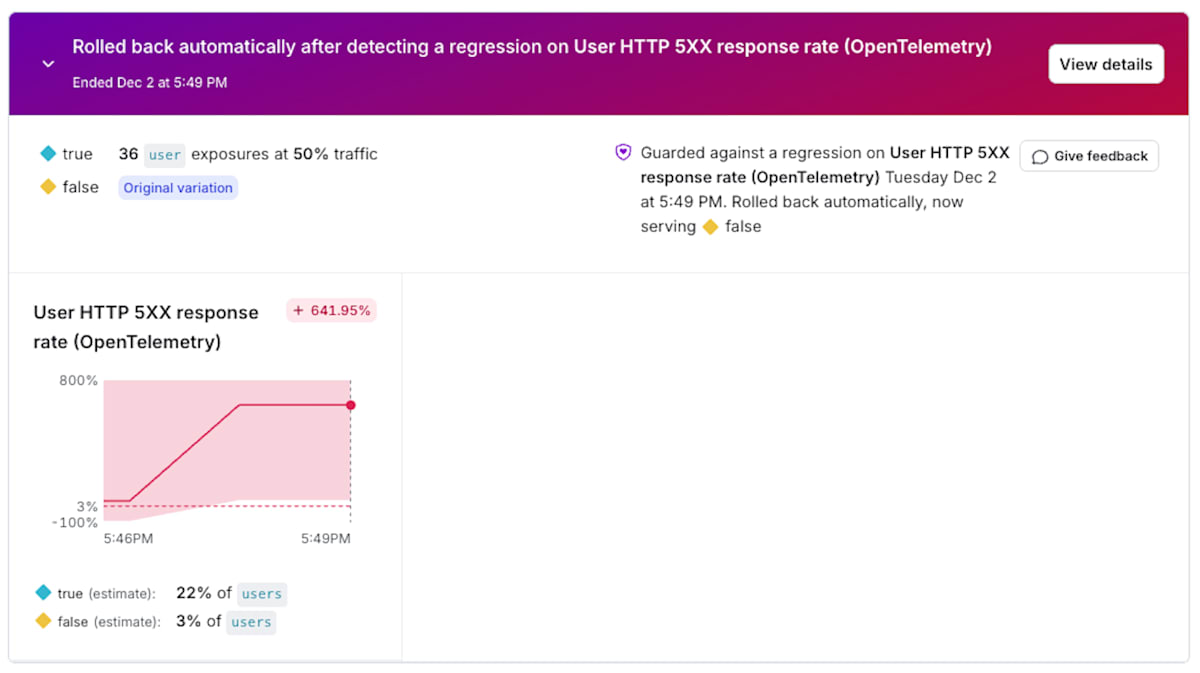
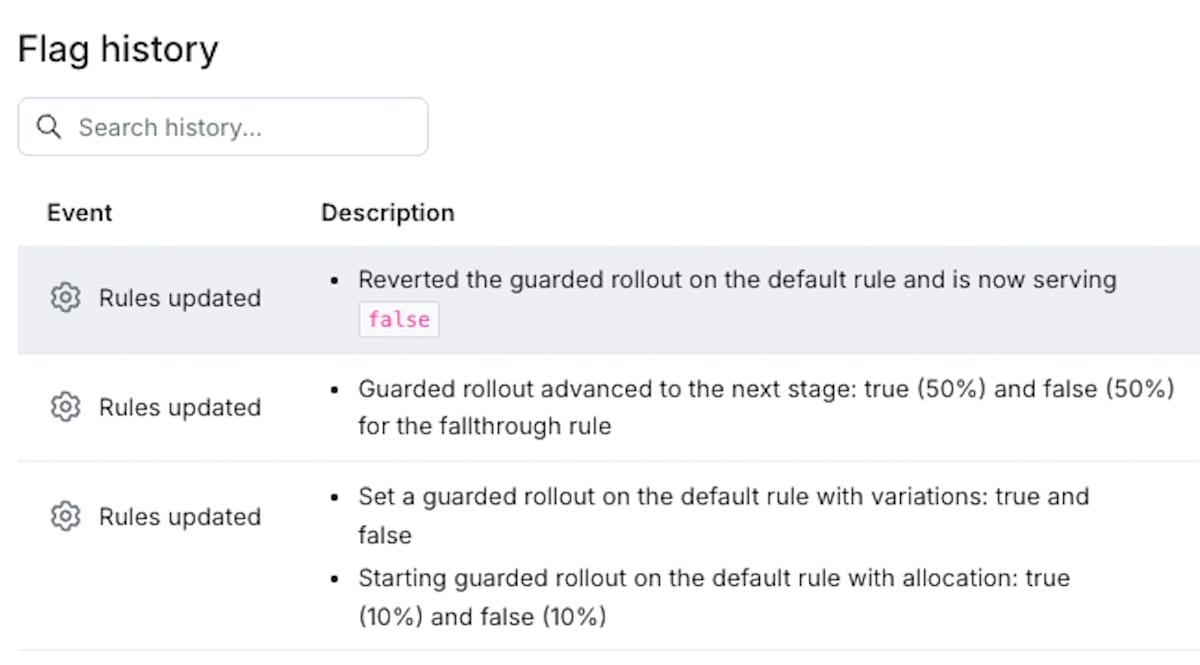
フラグの履歴を見ると、50%のロールアウトまで進みましたが500エラーがしきい値を超えたためフラグがfalse(トグルOFF)に変わったことがわかります。
おわりに
必要なのは実質2つだけです。
- OTelのトレース送信先へLDを追加
- フィーチャーフラグへGuarded rolloutを設定
デプロイは別のツールで行うとかOTel導入済みだとかLDのGuardianプランが必要だとか前提条件はあるものの、手軽にプログレッシブなリリース戦略を取れることがわかりました。
注意点は、メトリクスの信頼性を高くしようとして多くのトレース送ると思わぬコストが発生するかもしれないことくらいです。以下からコスト計算できます。

Discussion