TypstのCeTZパッケージで座標平面に円と直線を描く:三角関数の最大・最小問題
はじめに
X(旧Twitter)で@tekkinohoさんから面白い三角関数の最大・最小問題が投稿されました:
この記事では、この問題をTypstとCeTZパッケージを使って可視化する方法を詳しく解説します。特に座標平面上に円弧、直線、領域を描画するCeTZパッケージのコードについて丁寧に説明していきます。
問題と解答の概要
まず問題を整理しましょう。
問題:
解答のアプローチ:
-
(\cos \theta, \sin \theta) (0 \leq \theta \leq \pi) -
x + y \geq \frac{1}{2} -
y - x = k y = x + k k
結果は
以下がCeTZで作成した図です:
CeTZパッケージとは
CeTZは、Typstで図形を描画するための強力なパッケージです。座標系を使って点を配置し、線や図形を描くことができます。
まず、CeTZパッケージをインポートします:
#import "@preview/cetz:0.4.2"
CeTZ描画の基本構造
CeTZで図形を描くには、cetz.canvas()関数を使用します:
#cetz.canvas(length: 3cm, {
  import cetz.draw: *
  // ここに描画コードを記述
})
length: 3cmは、座標系の単位長さを指定しています。つまり、座標1が実際には3cmとして描画されます。
座標軸の描画
まず座標軸を描きます:
// 座標軸
line((-1.5, 0), (1.5, 0), stroke: (paint: black, thickness: 1pt), name: "x-axis")
line((0, -1.5), (0, 1.5), stroke: (paint: black, thickness: 1pt), name: "y-axis")

// 軸ラベル
content((1.5, -0.15), anchor: "north", text(size: 14pt, $x$))
content((-0.15, 1.5), anchor: "east", text(size: 14pt, $y$))
content((-0.15, -0.15), anchor: "north-east", text(size: 14pt, $O$))
line()関数で2点を結ぶ線分を描きます。strokeパラメータで線の色と太さを指定します。content()関数でテキストを配置し、anchorパラメータで配置位置を調整します。
円弧の描画
単位円の上半分(赤い円弧)
単位円の上半分を描画します:
arc((0, 0), start: 0deg, stop: 180deg, radius: 1, stroke: (paint: red, thickness: 2.5pt), name: "arc-red")
arc()関数は円弧を描きます:
- 第1引数: 中心座標
(0, 0) -
start: 開始角度(度数法) -
stop: 終了角度(度数法) -
radius: 半径 -
stroke: 線のスタイル
角度は右向き(x軸の正方向)を0度として、反時計回りに増加します。
条件を満たす部分(青い円弧)
直線
arc((0, 0), start: 120deg, stop: 180deg, radius: 1, stroke: (paint: blue, thickness: 2.5pt), name: "arc-blue")
120度から180度までの円弧を描くことで、条件
直線の描画
複数の直線を描画します:
// 直線 x + y = 1/2(黒線)
line((-0.5, 1), (1, -0.5), stroke: (paint: black, thickness: 1.5pt))

// 直線 y - x = √2(青線)
line((-0.5, calc.sqrt(2) - 0.5), (0.5, calc.sqrt(2) + 0.5), stroke: (paint: blue, thickness: 1.5pt))

// 直線 y - x = -1(紫線)
line((-0.5, -1.5), (1.2, 0.2), stroke: (paint: purple, thickness: 1.5pt))

// 直線 y - x = √7/2(緑線)
let k_max = calc.sqrt(7) / 2
line((-0.5, k_max - 0.5), (0.5, k_max + 0.5), stroke: (paint: green, thickness: 1.5pt))
それぞれの直線は異なる色で描画され、視覚的に区別しやすくなっています。calc.sqrt()関数で平方根を計算できます。
領域の塗りつぶし
条件
// 水色の領域(x + y ≥ 1/2 の部分)
// 多角形で近似
let pts = ()
for i in range(0, 61) {
  let angle = i * 3deg
  let x = calc.cos(angle)
  let y = calc.sin(angle)
  if x + y >= 0.48 {  // 少し余裕を持たせる
    pts.push((x, y))
  }
}
// 直線との交点を追加
let x1 = (1 - calc.sqrt(7)) / 4
let y1 = (1 + calc.sqrt(7)) / 4
pts.push((x1, y1))
pts.push((0.5, 0))

// 塗りつぶし
if pts.len() > 2 {
  line(..pts, close: true, fill: rgb(200, 240, 255, 150), stroke: none)
}
このコードのポイント:
-
forループで円弧上の点を3度ずつ計算 - 条件
x + y \geq 0.48 - 直線との交点を手動で追加
-
line(..pts, close: true)で多角形を閉じて描画 -
fillパラメータで塗りつぶしの色を指定(RGBA形式) -
stroke: noneで輪郭線を描画しない
rgb(200, 240, 255, 150)は、R=200, G=240, B=255, A=150(透明度)の水色を表します。
端点の描画とラベル
重要な点を円で強調し、ラベルを付けます:
// 端点
circle((1, 0), radius: 0.05, fill: blue, stroke: none)
let x_left = (1 - calc.sqrt(7)) / 4
let y_left = (1 + calc.sqrt(7)) / 4
circle((x_left, y_left), radius: 0.05, fill: blue, stroke: none)

// 端点のラベル
content((1, 0), anchor: "north-west", padding: 3pt, text(size: 12pt, $(1, 0)$))
content((x_left, y_left), anchor: "south-east", padding: 3pt, text(size: 10pt, $((1-sqrt(7))/4, (1+sqrt(7))/4)$))
circle()関数で小さな円を描き、fillで塗りつぶします。content()でラベルを配置し、anchorで位置を調整します。
図全体のコード
最後に、完全なコードを示します:
#set page(
paper: "a4",
height: 297mm,
width: 210mm,
margin: (x: 1.5cm, y: 1.5cm),
)
#set par(
justify: true,
leading: 1em,
)
#set text(
font: ("New Computer Modern","BIZ UDPMincho")
)
#show regex("[\p{scx:Han}\p{scx:Hira}\p{scx:Kana}]"): set text(font: "BIZ UDPGothic")
#set text(lang: "ja")
#set enum(numbering: "(1)",)
#import "@preview/colorful-boxes:1.4.2": *
#let my_block(back_color, frame_color, title_color, content_color, title, content) = {
block(width:auto,radius: 4pt, stroke: back_color + 3pt)[
#block(width: 100%,fill: back_color, inset: (x: 20pt, y: 5pt), below: 0pt)[#text(title_color,font: ("New Computer Modern","BIZ UDPMincho"))[#title]]
#block(radius: (
bottom: 3pt,
),width: 100%, fill: frame_color, inset: (x: 20pt, y: 10pt))[#text(content_color)[#content]]
]
}
#my_block(green.darken(20%),rgb(95%, 100%, 95%) , white, black, [\@tekkinoho さんからの最大・最小の問題], [
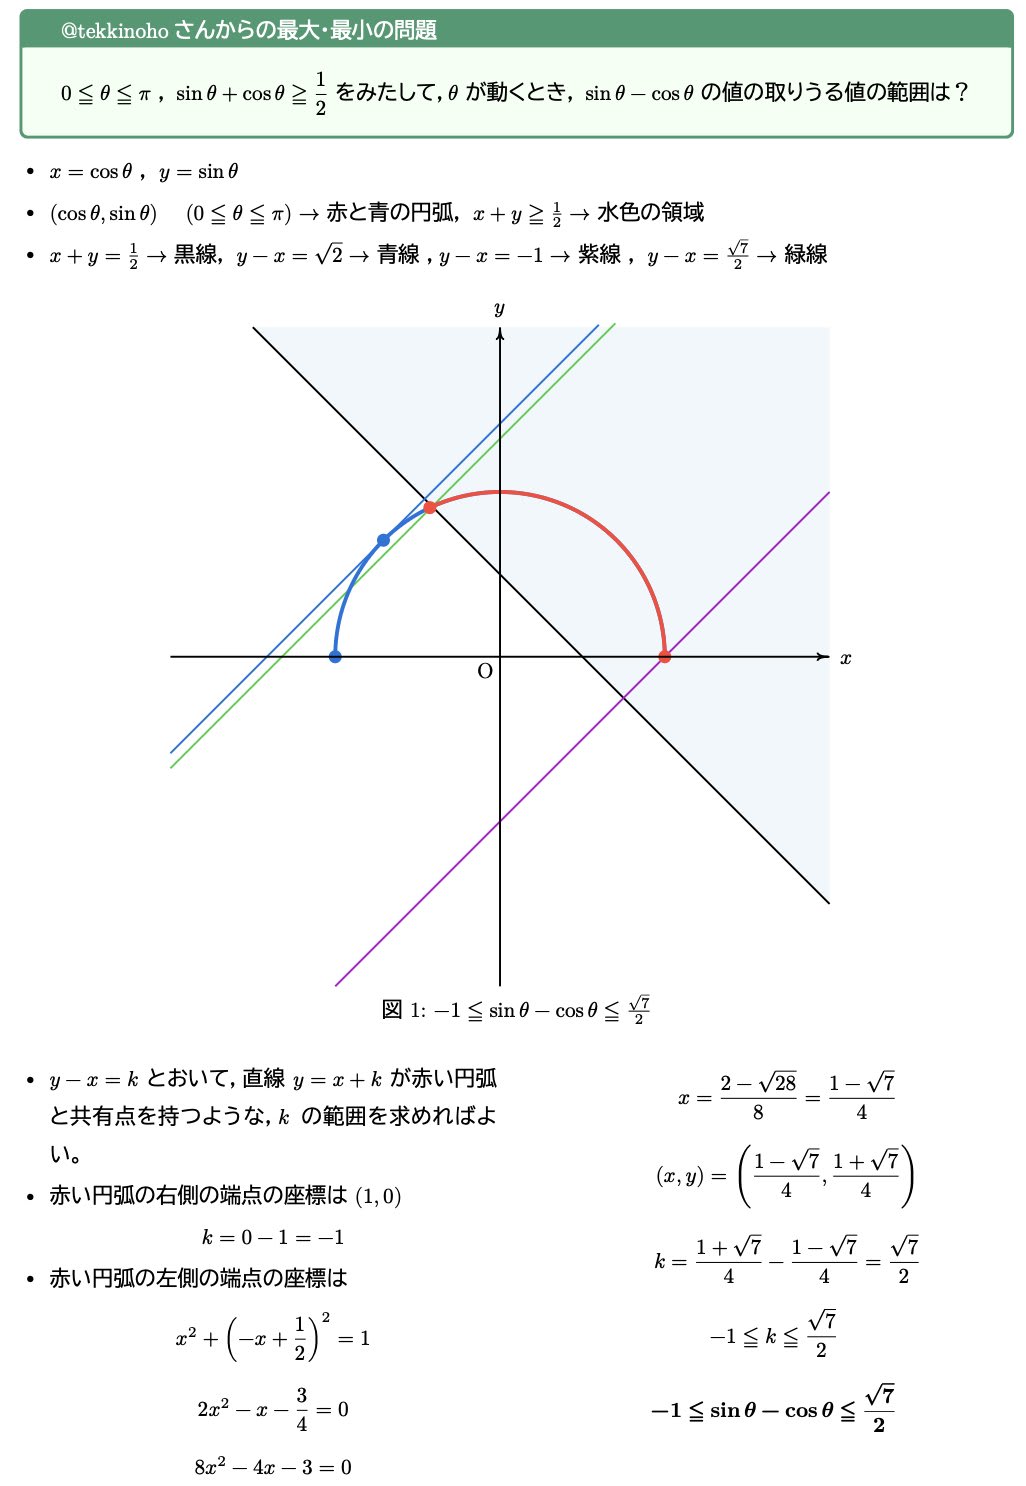
$0 lt.eq theta lt.eq pi$ , $sin theta + cos theta gt.eq 1/2$ をみたして,$theta$ が動くとき,$sin theta - cos theta$ の値の取りうる値の範囲は?
])
#h(5mm)
$x = cos theta$ , $y = sin theta$ とすると
- $(cos theta, sin theta)$ #h(3mm) $(0 lt.eq theta lt.eq pi)$ → 赤と青の円弧,$x + y gt.eq 1/2$ → 水色の領域
- $x + y = 1/2$ → 黒線,$y - x = sqrt(2)$ → 青線,$y - x = -1$ → 紫線,$y - x = sqrt(7)/2$ → 緑線
$y - x = k$ とおいて,直線 $y = x + k$ が赤い円弧と共有点を持つような,$k$ の範囲を求めればよい。
- 赤い円弧の右側の端点の座標は $(1, 0)$
$ k = 0 - 1 = -1 $
- 赤い円弧の左側の端点の座標は
$ x^2 + (-x + 1/2)^2 = 1 $
$ 2x^2 - x - 3/4 = 0 $
$ 8x^2 - 4x - 3 = 0 $
$ x = (2 - sqrt(28))/8 = (1 - sqrt(7))/4 $
$ (x, y) = ((1 - sqrt(7))/4, (1 + sqrt(7))/4) $
$ k = (1 + sqrt(7))/4 - (1 - sqrt(7))/4 = sqrt(7)/2 $
$ -1 lt.eq k lt.eq sqrt(7)/2 $
$ therefore -1 lt.eq sin theta - cos theta lt.eq sqrt(7)/2 $
#import "@preview/cetz:0.4.2"
#figure(
cetz.canvas(length: 3cm, {
import cetz.draw: *
// 座標軸
line((-1.5, 0), (1.5, 0), stroke: (paint: black, thickness: 1pt), name: "x-axis")
line((0, -1.5), (0, 1.5), stroke: (paint: black, thickness: 1pt), name: "y-axis")
// 軸ラベル
content((1.5, -0.15), anchor: "north", text(size: 14pt, $x$))
content((-0.15, 1.5), anchor: "east", text(size: 14pt, $y$))
content((-0.15, -0.15), anchor: "north-east", text(size: 14pt, $O$))
// 単位円(赤い円弧:0 ≤ θ ≤ π)
arc((0, 0), start: 0deg, stop: 180deg, radius: 1, stroke: (paint: red, thickness: 2.5pt), name: "arc-red")
// 青い円弧(直線 x + y = 1/2 より左側の部分)
arc((0, 0), start: 120deg, stop: 180deg, radius: 1, stroke: (paint: blue, thickness: 2.5pt), name: "arc-blue")
// 直線 x + y = 1/2(黒線)
line((-0.5, 1), (1, -0.5), stroke: (paint: black, thickness: 1.5pt))
// 直線 y - x = √2(青線)
line((-0.5, calc.sqrt(2) - 0.5), (0.5, calc.sqrt(2) + 0.5), stroke: (paint: blue, thickness: 1.5pt))
// 直線 y - x = -1(紫線)
line((-0.5, -1.5), (1.2, 0.2), stroke: (paint: purple, thickness: 1.5pt))
// 直線 y - x = √7/2(緑線)
let k_max = calc.sqrt(7) / 2
line((-0.5, k_max - 0.5), (0.5, k_max + 0.5), stroke: (paint: green, thickness: 1.5pt))
// 水色の領域(x + y ≥ 1/2 の部分)
// 多角形で近似
let pts = ()
for i in range(0, 61) {
let angle = i * 3deg
let x = calc.cos(angle)
let y = calc.sin(angle)
if x + y >= 0.48 { // 少し余裕を持たせる
pts.push((x, y))
}
}
// 直線との交点を追加
let x1 = (1 - calc.sqrt(7)) / 4
let y1 = (1 + calc.sqrt(7)) / 4
pts.push((x1, y1))
pts.push((0.5, 0))
// 塗りつぶし
if pts.len() > 2 {
line(..pts, close: true, fill: rgb(200, 240, 255, 150), stroke: none)
}
// 端点
circle((1, 0), radius: 0.05, fill: blue, stroke: none)
let x_left = (1 - calc.sqrt(7)) / 4
let y_left = (1 + calc.sqrt(7)) / 4
circle((x_left, y_left), radius: 0.05, fill: blue, stroke: none)
// 端点のラベル
content((1, 0), anchor: "north-west", padding: 3pt, text(size: 12pt, $(1, 0)$))
content((x_left, y_left), anchor: "south-east", padding: 3pt, text(size: 10pt, $((1-sqrt(7))/4, (1+sqrt(7))/4)$))
})
,caption: [$-1 lt.eq sin theta - cos theta lt.eq sqrt(7)/2$]
)
CeTZの主要機能まとめ
この記事で紹介したCeTZの主要機能をまとめます:
基本図形
-
line(点1, 点2, ...): 線分・折れ線を描画 -
arc(中心, start: 角度, stop: 角度, radius: 半径): 円弧を描画 -
circle(中心, radius: 半径): 円を描画
スタイル設定
-
stroke: 線のスタイル(色、太さ)stroke: (paint: red, thickness: 2pt)
-
fill: 塗りつぶしの色-
fill: rgb(200, 240, 255, 150)(RGBA形式)
-
-
stroke: none: 輪郭線を描画しない
テキスト配置
-
content(座標, text(...)): テキストを配置 -
anchor: テキストの基準位置("north", "south", "east", "west"など) -
padding: テキストと基準点の間隔
計算機能
-
calc.sqrt(x): 平方根 -
calc.cos(angle): コサイン -
calc.sin(angle): サイン
制御構造
-
let 変数 = 値: 変数定義 -
for i in range(開始, 終了): forループ -
if 条件 { ... }: 条件分岐
まとめ
この記事では、TypstのCeTZパッケージを使って座標平面上に円弧、直線、領域を描画する方法を解説しました。特に以下のテクニックを紹介しました:
-
arc()を使った円弧の描画 -
line()を使った直線の描画 - forループと条件分岐を使った領域の塗りつぶし
-
circle()を使った点の強調 -
content()とanchorを使ったテキストラベルの配置
CeTZパッケージは、数学的な図形の描画において非常に強力なツールです。座標を計算し、条件分岐やループを使うことで、複雑な図形も正確に描画できます。
三角関数の最大・最小問題のような数学の問題を可視化することで、理解が深まります。ぜひ、皆さんもCeTZを使って美しい数学の図形を描いてみてください!
Discussion