agentless metric collection for Amazon EKSについて検証してみました。
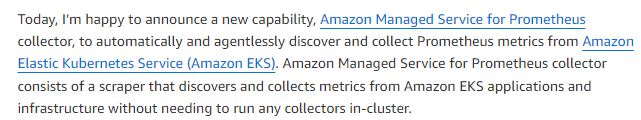
フルマネージドで、エージェント不要でPrometheusメトリクスをAmazon managed for Prometheusに収集できる機能がアナウンスされました。
サンプルなClaude2を呼び出すFlaskアプリでprometheusメトリクスを送信できるまでの流れを書きたいと思います。
(https://aws.amazon.com/blogs/aws/amazon-managed-service-for-prometheus-collector-provides-agentless-metric-collection-for-amazon-eks/)[https://aws.amazon.com/blogs/aws/amazon-managed-service-for-prometheus-collector-provides-agentless-metric-collection-for-amazon-eks/]
このエントリーは OpenTelemetry Advent Calendar 2023, 10日目の記事です!
agentless metric collection for Amazon EKS
- 本機能を利用することで、Podのprometheus metricsを収集することができます
- AWS Distro for OpenTelemetry Operatorの違い
ADOTは、テレメトリデータ (ログ、メトリクス、トレースなど)を取り込みに対応していますが、本collectorはprometheus metricsのみになります。
試してみた。
検証構成図

VPC、VPCendpoint、NAT Gatewayを作成
Flask アプリの作成
(https://github.com/clouddev-code/flask-cluade-api.git)[https://github.com/clouddev-code/flask-cluade-api.git]
Google Chat + Claude2 LLMsのアプリ
アプリのレイテンシなど取得できる、prometheus-flask-exporterを組み込んでいます。
Google Chatのwebhookから送信されるリクエストフォーマット
Amazon Managed for Prometheus
Amazon managed for prometheus workspacesを作成
EKS環境の準備
(利用する場合は、subnet idは各自の環境に置き換えてください)
Fargate profile、OIDCの設定も行う設定となっています。
EKS Pod Identify
PodにIAM Roleをつけられる機能で、BedrockのivokeModelを許可しようとしましたが、Fargate Podで試すので、IRSAで実施しました。
IRSA
IRSAでBedrock Claude2 Modelを呼ばせる権限をPodに付与します。
基本下記記事を参考にしました。
ALB Ingress Controller
下記手順で概ね問題ないがAWSLoadBalancerControllerIAMPolicyのポリシーで一部追加が必要になります。
Deploymentのデプロイ
agentless metric collection でCollect
scraperのコンフィグを取得。
aws amp get-default-scraper-configuration --output text --region ap-northeast-1 | base64 -D > default.yml
上記で取得したコンフィグをbase64にエンコードに変換して、scraperを作成。
aws amp create-scraper \
  --source eksConfiguration="{clusterArn='arn:aws:eks:ap-northeast-1:905860205176:cluster/my-cluster', securityGroupIds=['sg-xxxxxxxxxxxxxxxx'],subnetIds=['subnet-xxxxxxxxxxxxxxx', 'subnet-xxxxxxxxxxxxxxxx']}" \
  --scrape-configuration configurationBlob=$(cat default.yml | base64) \
  --destination ampConfiguration="{workspaceArn='arn:aws:aps:ap-northeast-1:xxxxxxxxxxxx:workspace/ws-2f6c2393-55f0-4bfc-bd97-54dc4a66f029'}"
EKSクラスタに、metrics scrapingを設定
eksctl create iamidentitymapping --cluster cluster-name --region region-id --arn roleArn --username aps-collector-user
ENIにLambda ?で使われていることから、scraperはLambdaでmetricsを収集しているようにみえる。
scraperですが、Amazon managed for prometheusのワークスペースを削除しても残り続けますので、削除する必要があります。
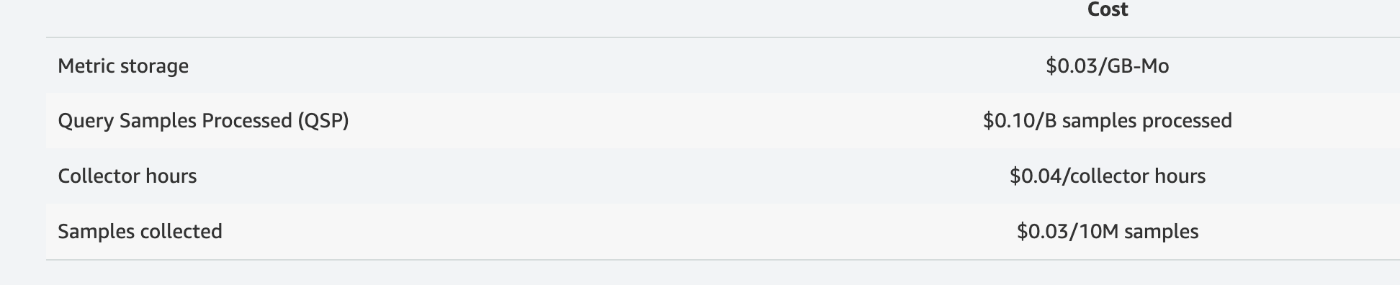
Collector hours $0.04/collector にかかるので、$0.04 * 24 * 30 = $28.8程度はかかりそうです。
制限事項
metrics 収集するレスポンスサイズは、50MB以内である必要があります。
まとめ
Prometheus metricsに限るなら、手軽に収集することが可能です。Traceを利用するのであれば、ADOTを使ようになります。
脚注
Discussion