🗂
Rで複数の回帰モデルの結果を並べてプロットする
はじめに
例えばモデルにおけるある特定の変数について、推計の頑健性を確認したいとします。
この時よく行われるのは、説明変数を追加した回帰を行っても、係数が安定しているか確認することです。
そこでここでは、異なるモデルにおけるある変数の頑健性を、視覚的に評価する方法を紹介します。
サンプルデータの作成
今回は、以下のようなデータを用いることとします。
関心のある変数は、'tgt'です。
library(tidyverse)
library(broom)
library(ggthemes)


set.seed(8284)
data <- data.frame(tgt = rnorm(400),
                   x1 = rnorm(400),
                   x2 = rnorm(400),
                   x3 = rnorm(400)) |>
  mutate(y = 0.2*tgt+0.4*x1+0.6*x2+0.8*x3+rnorm(400))
モデルの作成
続いて、以下のように複数のモデルを作成し、まとめて回帰していきます。今回は非常にシンプルな単回帰及び重回帰分析です。
formulas <- c(
  "y ~ tgt",
  "y ~ tgt + x1",
  "y ~ tgt + x1 + x2",
  "y ~ tgt + x1 + x2 + x3"
)

models <- tibble(model_name =  c("model1", "model2", "model3", "model4"),
                 formula = formulas)

df_models <- models |>
  mutate(model = map(formula, ~lm(.x, data = data))) |>
  mutate(coef = map(model, ~tidy(.x))) |>
  unnest(coef) |>
  mutate(model_name = factor(model_name, levels = c("model1", "model2", "model3", "model4")))|>
  mutate(conf.low = estimate - 1.96*std.error,
         conf.high = estimate + 1.96*std.error)
プロット
一つ上のセクションで得られた結果をプロットしていきます。このとき、geom_pointrange関数におけるオプションの'position'を用いることで、異なるモデルの推計結果が重なることなく出力されます。
df_models |>
  ggplot(aes(x = term,y = estimate, ymin = conf.low, ymax = conf.high)) +
      geom_pointrange(aes(color = model_name), position=position_dodge(width=.5)) +
      geom_hline(yintercept = 0, linetype = "dashed") +
      theme_clean() +
      theme(axis.title.x = element_blank(),
            axis.title.y = element_blank(),
            ) +
      scale_color_wsj()
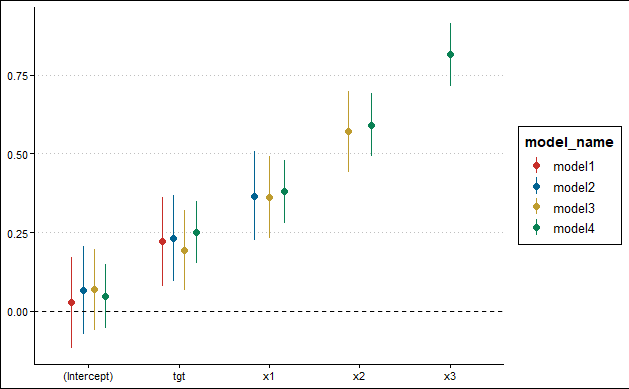
'tgt'の係数が、モデルを追加しても安定していることが確認できました。
Discussion