〽️
Recoil・jotaiのデータフロー図を可視化するツール state-tracer の紹介
先日Recoilとjotaiのデータフロー図を可視化するツールを作成したので紹介します。
デモ
# Recoil
npx @state-tracer/recoil src

# jotai
npx @state-tracer/jotai src
これだけで以下のような画像が生成されます。
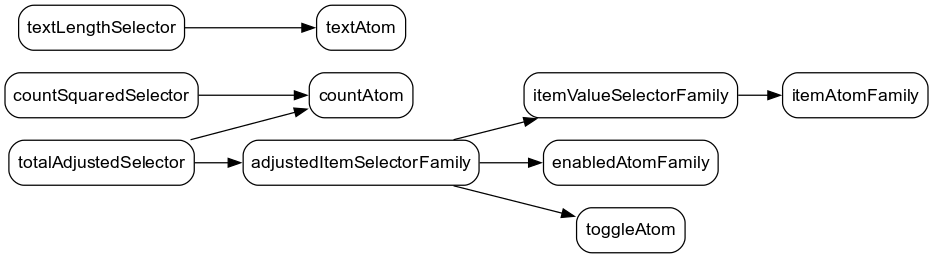
データフロー図の元になっているコード(chatGPT作)
import { atom, selector, atomFamily, selectorFamily } from 'recoil';

/**
 * atom: 基本の状態
 */
const countAtom = atom<number>({
  key: 'countAtom',
  default: 0,
});

const textAtom = atom<string>({
  key: 'textAtom',
  default: 'hello',
});

const toggleAtom = atom<boolean>({
  key: 'toggleAtom',
  default: false,
});

/**
 * atomFamily: 引数に基づいて状態を持つファミリー
 */
const itemAtomFamily = atomFamily({
  key: 'itemAtomFamily',
  default: (id: number) => ({id, value: id * 10}),
});

const enabledAtomFamily = atomFamily({
  key: 'enabledAtomFamily',
  default: true,
});

/**
 * selector: atomや別selectorから派生した値
 */
const countSquaredSelector = selector<number>({
  key: 'countSquaredSelector',
  get({get}) {
    const count = get(countAtom);
    return count * count;
  },
});

const textLengthSelector = selector<number>({
  key: 'textLengthSelector',
  get({get}) {
    const text = get(textAtom);
    return text.length;
  },
});

/**
 * selectorFamily: 引数付き派生状態
 */
const itemValueSelectorFamily = selectorFamily<number, number>({
  key: 'itemValueSelectorFamily',
  get:
    (id) =>
    ({get}) => {
      const item = get(itemAtomFamily(id));
      return item.value;
    },
  set:
    (id) =>
    ({get, set}, newValue) => {
      const oldItem = get(itemAtomFamily(id));
      set(itemAtomFamily(id), {...oldItem, value: newValue as number});
    },
});

/**
 * 複雑に絡むselectorFamily
 * ・特定のidに対してenabledかつtoggleAtomがtrueなら、valueを2倍にするなどのルールを持つ
 */
const adjustedItemSelectorFamily = selectorFamily<number, number>({
  key: 'adjustedItemSelectorFamily',
  get:
    (id) =>
    ({get}) => {
      const enabled = get(enabledAtomFamily(id));
      const toggle = get(toggleAtom);
      const value = get(itemValueSelectorFamily(id));
      if (enabled && toggle) {
        return value * 2;
      }

      return value;
    },
});

/**
 * さらに全体の合計値を算出するselector
 * 複数のitemId(1~3までで例示)を使う
 */
const totalAdjustedSelector = selector<number>({
  key: 'totalAdjustedSelector',
  get({get}) {
    let total = 0;
    for (let id = 1; id <= 3; id++) {
      total += get(adjustedItemSelectorFamily(id));
    }

    return total + get(countAtom);
  },
});
このようにデータフロー図を見ることでアプリケーションの全体像の把握や、設計をする時に役立つと考えています。
使用した技術
言語はTypeScriptを使用しており、以下のライブラリを使用しています。
コードはこちら
仕組み
まず指定されたディレクトリ内のファイルをすべて取得し、そのファイル内で定義されたstate(atomなどで作られた変数)を抽出します(抽出しているコード↓)。
その後、state内で使用されている別のstateがあるかを確認し、依存配列を構築します。
import { atom, selector } from 'recoil';

const countAtom = atom<number>({
  key: 'countAtom',
  default: 0,
});

const countSquaredSelector = selector<number>({
  key: 'countSquaredSelector',
  get({get}) {
    // countAtomを使っているため、このstateはcountAtomに依存していることになる
    const count = get(countAtom);
    return count * count;
  },
});
依存配列を構築した後、Graphvizというライブラリでsvgを生成するために、依存配列をDOT言語を用いたグラフ構造に変換します。
最後にGraphvizでsvgを生成します。
終わり
巨大なRecoil/jotaiアプリケーションに対してこれを実行すると、とても面白いスパゲッティ構造を見ることができるのでぜひお試しください。
Discussion