📊
matplotlibの fig, axで凡例がはみ出る時の対処法
このように凡例がはみ出してしまう場合
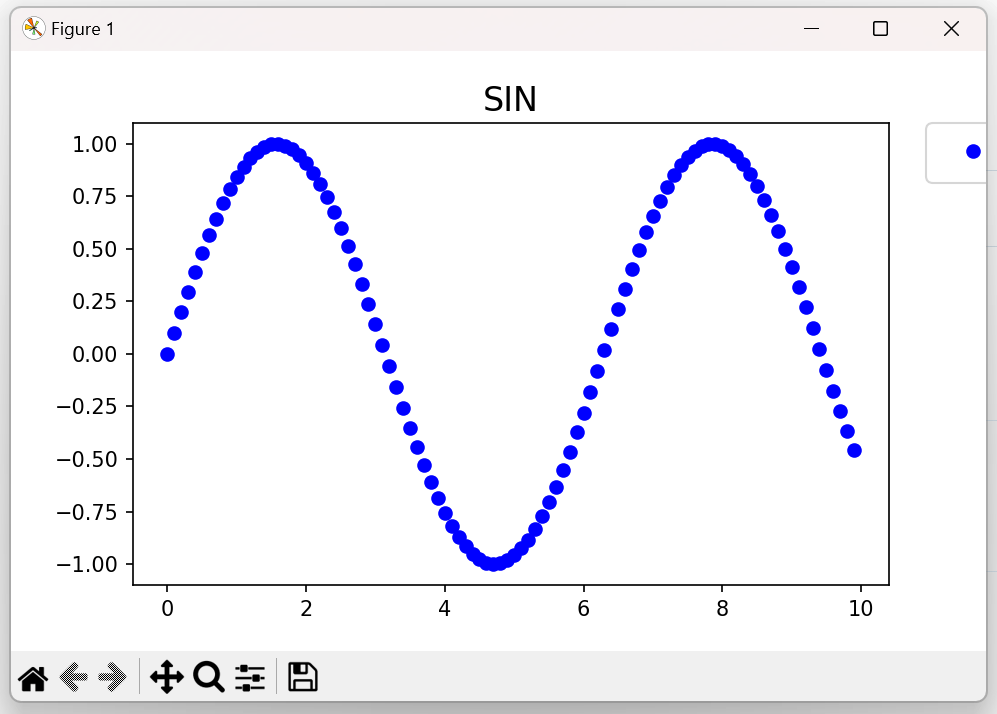
以下を最後に追加する。
fig.tight_layout()
修正後
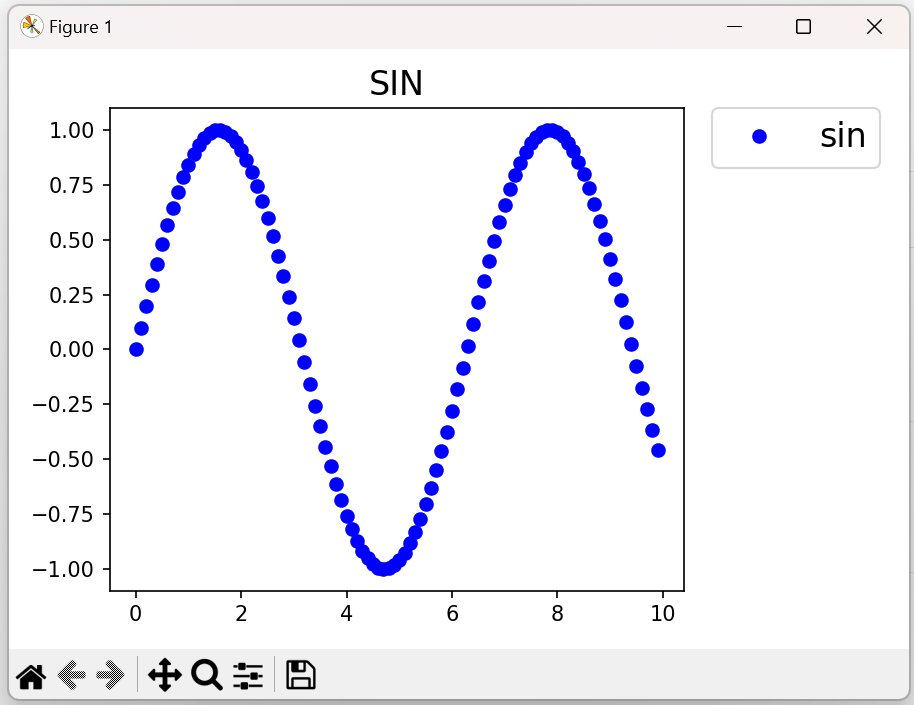
無事、凡例がFigure内に収められる
plot.を使っている人 (pyplot使用者の場合)
plt.tihgt_layout()
でいけます。
例
import numpy as np
import matplotlib.pyplot as plt

x = np.arange(0,10,0.1)
y = np.sin(x)

# 表示
fig, ax = plt.subplots(1,1,figsize=(6,4))
ax.set_title("SIN", fontsize = 16)
ax.plot(x, y, 'ro',label="sin", color="blue")
ax.legend(bbox_to_anchor=(1.05, 1), loc='upper left', borderaxespad=0, fontsize=16)

#*******この部分************************
fig.tight_layout() #すべての要素を図内に収める
plt.show()
#***************************************
参考
Discussion