【学習】「Datadog Learning Center Learning Path」
Datadog Learning Center Learning Path
始める前に
Datadog Learning Center に Learning Path が充実してきたので、一通り見て有用な学びを追記していく
Universal Learning Paths
Core Skills Learning Path
タグ付けのドキュメント
ホスト名の変更は hostname: で自動検出されたホスト名をオーバーライド。
コンテナプラットフォームのラベルをタグに変換する環境変数は推奨したい。
-
DD_KUBERNETES_POD_LABELS_AS_TAGS
https://docs.datadoghq.com/ja/getting_started/tagging/assigning_tags/
Metrics
count, rate, gauge, histgram, distribution の種類がある。
histgram, distribution はどちらも統計的な集計メトリクスだが、distribution は複数のソースから集計した集計値を扱う。
Monitors
[+New Monitor] や Metrics Explorer の [More...] など、いろいろなところからモニターが作れる。動線がそんなに良くないのが課題。
Configuration Learning Path
構成情報の優先順位
Remote Configration > 環境変数 > datadog.yaml
These are listed in the order of precedence. This means that if a configuration is set using environment variables, it will override the same configuration set in the
datadog.yamlfile. If a configuration is set using Remote Configuration, it will override both environment variables and thedatadog.yamlfile.
datadog-agent コマンド
datadog-agent status と datadog-agent config の使い道
datadog-agent config|grep ^env などで config を grep するのは良さそう。
デフォルトではログ機能は無効化 logs_enabled: false APM トレース受け取りは有効化 apm_config: enabled: true。
Tips
Datadog Log Management 画面はログが来ていても [Get Started] を押して進める必要がある。
ホスト名の決定方法
-
https://docs.datadoghq.com/ja/agent/faq/how-datadog-agent-determines-the-hostname/
Datadog(Agent) のネットワークトラフィック - https://docs.datadoghq.com/agent/configuration/network/
Docker ホストの構成図

ホスト条で実行される Datadog Agent プロセスでも Datadog Agent コンテナでもいいよ
Whether the Agent runs as a process directly on a host or in a container, it is capable of monitoring aspects of the host, including CPU usage, filesystem operations, memory utilization, running processes, and network activity.
/var/run/docker.sock にアクセスされるように設定され、/proc や /sys/fs/cgroups にもアクセスし基盤となるホストの監視を行う。
docker compose exec で Docker Compose 上の Datadog Agent コマンドを実行。
Autodiscovery は色々な推奨事項が出てくるので地味に便利。設定が難解なのでドキュメントを要確認。autoconfig_exclude_features で特定のものを除外できる。
Integrations
AWS, Azure, Google Cloud の全てでサービス毎にメトリクスの取得が制御できるようになった。
APM の情報取得は Library Integrations とも呼ぶ。
Agent Check(system check, disk check etc) は手動で実行できる。実行コマンドは dd-agent agent check disk のような形式。
The Agent automatically runs system integration checks every 15 seconds. You can also run a check manually. This is something you might do while troubleshooting or developing your own check, because it also prints a lot of diagnostic information.
Integration は以下の内容でステータスが表示される。他にも Broken が表示される。
Autodetected Integrations have been detected by the Agent but haven't been configured yet.
Installed integrations have been detected by the Agent and do not require configuration.
Available integrations are everything else, including non-Agent integrations, which you'll learn about in the next activity.
専用のダッシュボードのないシステムチェックはインテグレーションタイルに表示されない。
System checks such as
disk,cpu, andioare not listed here because they don't have exclusive dashboards. But their metrics are incorporated into other dashboards that you'll see in a minute.
Universal Service Monitoring(USM)
USM は eBPF を使うよ。
When you enable USM, the Datadog Agent begins to automatically parse HTTP(S), HTTP/2, and gRPC traffic from the kernel network stack through eBPF (extended Berkeley Packet Filter). This allows the Agent to collect RED metrics (request, error, and duration) from compatible services in your infrastructure. As you deploy new services, USM will automatically detect them in real time and begin to monitor them.
Persona-Based Learning Paths
Backend Engineer Learning Path
APM, Log, Infra+CNM に焦点を当てている。ここで CNM が出てくるのが面白い。
APM
APM はメトリクスとトレースを収集する。APM ≠ トレースだし、APM ≠ 分散トレースですよ。
APM collects two primary types of data:
- Metrics represent aggregated data that summarizes service performance, such as number of requests, response times, error count, and resource usage, which provides a high-level view of how services perform over time.
- Traces are detailed records of individual requests as they flow through services, showing how long each part of a request takes, dependencies among services, and where any errors occur.
Datadog は RED メトリクスに焦点を当てている。
Datadog はフレームグラフが可視化のデフォルトだが、最近はウォーターフォールも対応している。
Span tag/attribute はどちらもスパンに付く Key-Velue のコンテキストだが、タグはアプリケーションの動作の基盤となる情報を属性はスパン特定のコンテンツを保持する。どちらもトレースをフィルタリングするために利用できる。
Datadog のサービス詳細画面の使い方がよくまとまっている。
Log Management
- ログが解決を手助けしてくれる5つの W

Datadog は取り込みと保持を分離したモデルなので、全てのログを取り込んでから最適なものだけを保持できる。Log Explorerとログ画面の UI について詳細に説明があるのが良い。ログ画面は再度パネルとして表示されるので、たくさんの情報を参照できる上に元の画面に戻りやすい。ここでもタグと属性の話があるが、スパンと扱いは同じ。タグはログ「が」属するコンテキストで、属性はログ「に」属するコンテキスト。
検索はかなり柔軟にできるのでシンタックスは知っておきたい。ファセットとメジャーは一度作ると変えられないので注意。
エクスポートとビューの保存は地味に便利なので覚えておきたい。
Cloud Network Monitoring
IP アドレス・ポート・RTT(往復時間)・レイテンシー・TCP・再送などを監視できる。これはネットワークの問題の特定だけではなく、予期していないサービス間通信やパケロスの追跡、コスト最適化、セキュリティの強化などにも役立つ。
Frontend Engineer Learning Path
APM, Log, RUM, Synthetics に焦点を当てている。APM, Log は上記のコースと同じ。
Real User Monitoring
UX の定量的な測定と追跡の難しさは、アーキテクチャの複雑性・SEO の考慮・実ユーザーの獲得の難しさ・データの独立性が理由となっている。
RUM はアプリケーションパフォーマンスとユーザーの詳細と行動の両方の観点からデータを取得する。
Synthetic Monitoring
良いユーザーエクスペリエンスを保つのは難しいので、定常的に合成監視を行うメリットがある。
Pupetter, Playwright, Selenium などのツールと似ているが、GUI を持ちながら多地点からのテストや自動修復機能を持ち、Datadog のプラットフォームの特性を活かしたアラートや他の監視情報との相関ができるのが強み。
テスト結果も Explorer で検索ができる。
Site Reliability Engineer Learning Path
APM, Infra+CNM に加えて、SLO, Incident Management に焦点を当てている。
Service Level Objectives(SLOs)
前提のコースがあるのでその内容は省略されている。
Datadog の SLO はメトリクス・モニターから作る他に、タイムスライスとい時間間隔内のパフォーマンスをそのまま可視化できる方法がある。稼働時間(可用性)・レイテンシー・エラー率・ダウンタイム・エラー閾値・応答時間・スループットなどの SLO が柔軟に作成できる。
SLO の元となる SLI はユーザー満足度の代替指標である必要がある。一方でそれに無関係だったり、ただ単に複雑すぎたり、実用的でない内容とならないことが重要。
エラーバジェットとバーンレートはこの辺りを参考にしたい。
Incident Management
インシデント管理の重要性が説かれている。
アラート→インシデント宣言→優先順位付→影響範囲の確認→インシデント調査→修復→事後分析の順で対応を行う。ツールもそれに倣って設計されている。
Datadog の Incident Management は Slack と密に統合されているので /datadog incident などのコマンドでスラック上から操作を行える。
Application Security Engineer Learning Path
コースの名称も App & API Protection になっていて対応が早い。旧 ASM のこの機能はなかなか他にはないイケている機能群。
App & API Protection(AAP)
Security Traces は APM のトレース情報を元にして、攻撃パターンの検知とセキュリティ関連の対処を示してくれる。検知ルールとセキュリティシグナルは一対一ではなく、誤検知を避けるために練られたルールがあり、カスタマイズも可能。In-App WAF は最終防衛ラインとしてリアルタイムに特定の IP アドレスからのリクエストをブロックできる。
ラボの記載は AppSec のまま。 OWASP Top Ten を意識した対策を体験できる。StoreDog ではなく、NodeGoat を使う。APM と同じ tcp/8126 を使う。
- 脆弱性スキャン: Nikto でスキャン行い、スキャンの内容に応じてセキュリティトレースが記録される。
nikto -host 127.0.0.1 -port 4000のようにポートスキャンを行える。 - XSS:
var preTax = eval(req.body.preTax);に任意のコードを読み込ませて XSS を試みるシナリオ。User ID を取得して攻撃元を識別する。 - SQLi: User ID に
SELECT first_name, last_name FROM users WHERE user_id = '' OR '1'='1';や%' or 0=0 union select null, version() #を入れて、ユーザー ID や DB バージョンを抜き出す。 - SSRF: ここでこのサンドボックスが Google Cloud でホストされていることが明かされる。GCE のメタデータを取得しにいって、スタートアップスクリプトから脆弱な情報を見つけることもできるとのこと。
In-App WAF を使うにはいくつかの前提条件があるが、最新の Datadog Agent や API Key を利用していれば特に意識せずに使い始められる。In-App WAF のルールは Datadog 側で管理されている OOTB rule が多くあり、これを Remote Configuration で動的に有効化できる。また、ルールを monitoring, blocking, disabled に設定できるので、任意のルールを有効化・無効化・ドライランできる。
ログインのような重要なユーザーのアクティビティを監視することもできる。ビジネスロジックも OOTB の設定がある。
トレースに認証ユーザーの情報を載せるのはここを見る。
Cloud Security Engineer - Cloud SIEM Learning Path
Cloud SIEM 用の Learning Path。
Cloud SIEM
Cloud SIEM は Log Management 上のクラウドネイティブ SIEM 機能。Content Pack, OOTB rule で簡単に始められる。各コンテンツパックは専用の脅威検知ルールの表示画面を見れる。
Cloud SIEM はログ検出だけではなく、シグナル相関で複数のシグナルを相関させたルールが存在する。検出ルールはクローンして編集もできる。Signal Explorer は他と同じ。
SIEM Investigator は IAM の設定とアクティビティを元にクラウド内の疑わしいアクティビティを視覚化して調査できる。
Group by Tactic にすると説明しやすそう。 MITRE ATT&CK tactics に沿ったマップビューが新しくできている。
こんな感じの攻撃を行うシナリオ。New AWS account seen assuming a role into AWS account が検出される。
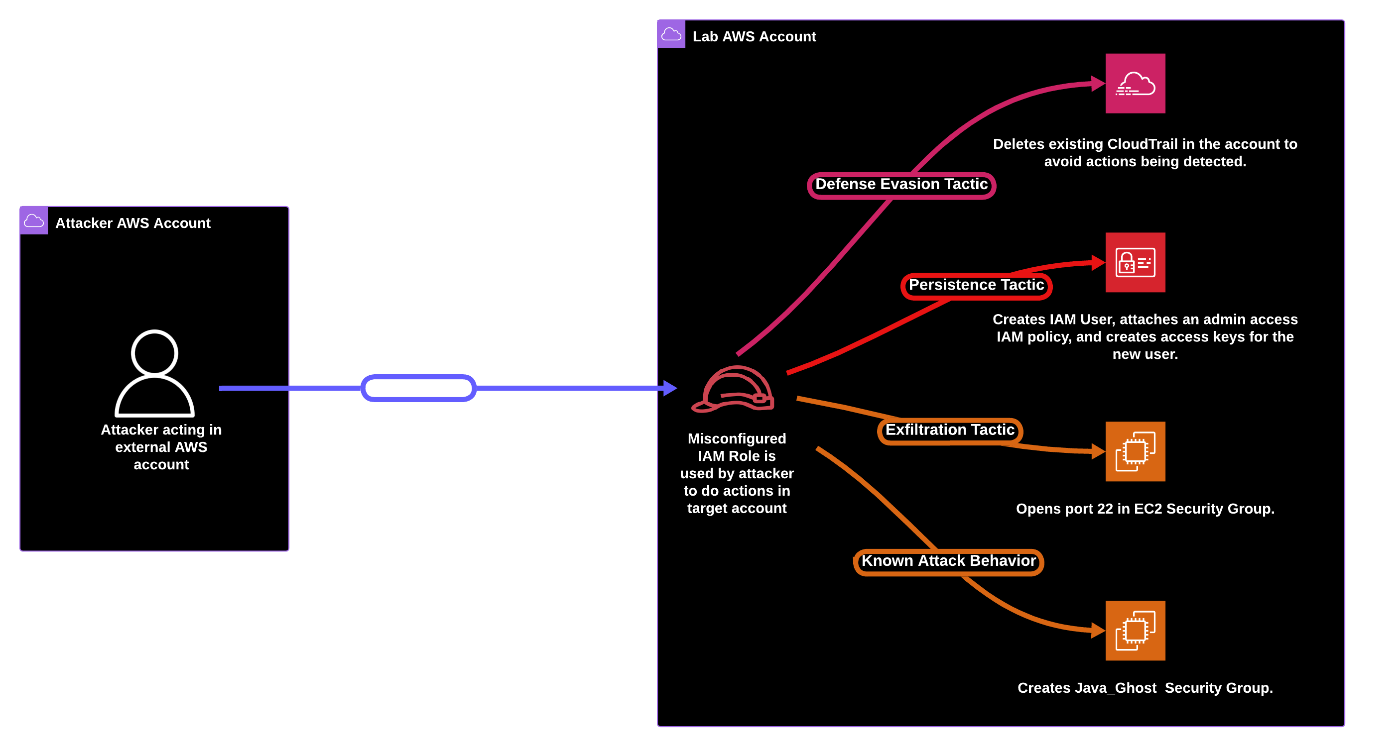
攻撃の様子は Investigater で確認できる。現在は AWS, Google Cloud, Azure, Datadog の Investigater がある。ダッシュボードも埋め込みになってだいぶ見やすい。ラボと最新の UI は既にもう一致していない。
最後に CTF がある。
- Flag1: 作成された IAM User 名を答える
- Flag2: AWS IAM AdministratorAccess ポリシーを適用する MITER tactic の名称を答える
- Flag3: 攻撃時の STS イベントタイプを答える
- Flag4: 攻撃で影響のあった AWS サービス
- Flag5: 削除された CloudTrail トレイルログはどのリージョンにあったか
- Flag6: 高重大度のセキュリティシグナルに隠されたフラグを答える
Cloud Security Engineer Learning Path
Cloud Security Management の Vulnerability, Misconfiguration と Workload Protection に分かれている。
Cloud Security Misconfiguration
コースのラボはメンテナンス中だったので、後日取り組むかも。
CSM は Misconfiguration, Identity Risks, Threats, Vulnerabilities からなる。それぞれ設定方法とデータソースが異なるので注意。Security Inbox は AAP(App & API Protection) と共通。
CSM Misconfiguration は、リソースの種類に応じて15分から4時間までの間隔でクラウドリソースを評価します。OOTB rule ももちろんあり、オープンソースポリシー言語の Rego で新しいルールを記載できる。
コンプライアンス画面では各コンプラインスへの準拠スコアが確認できる。最新のサポートされるフレームワークは Supported Frameworks を確認。
Cloud Security Workload Protection
CSM に限らずこの画面いいよね。
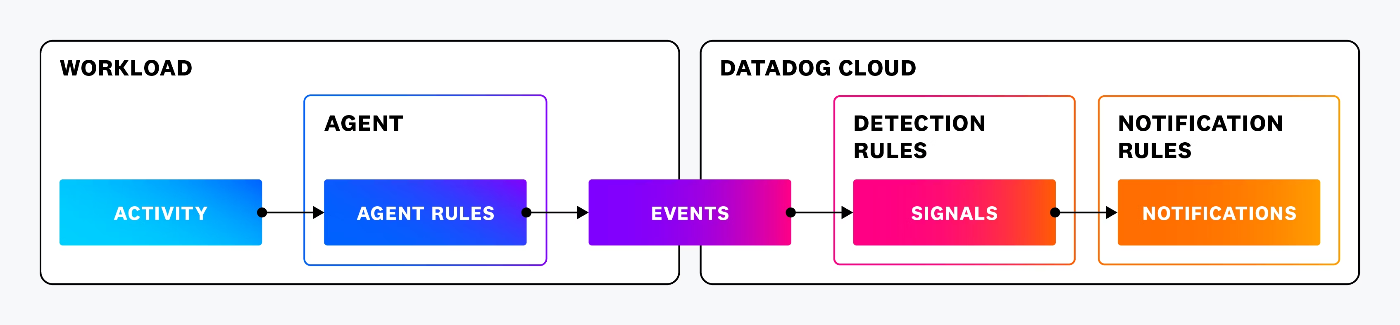
Workload Protection の検知ルール表現は Datadog 独自言語の Datadog’s Security Language (SECL) で表現される。
Agent 側のルールでイベントを記録し、Datadog 側で検知を行う仕組み。セキュリティシグナルの他に Agent Events Explorer もあるので、ここも見ておきたい。(UI 上では Investigate のタブ)
ラボは疑わしいプロセス・カーネル操作・ネットワーク操作・ファイル操作を見てみる形。
Product-Based Learning Paths
Dashboards Learning Path
Dashboard 関連で複数のコースがあるのがいいよね。個人的には Query Value はもっと使って欲しい。
最近は Wildcard Widget が追加されたので使いこなしたい。
Table Widget は Column formattingを使った方が可視性が上がる。
Architecture Widgets はもう少しいろいろと融通が利いて欲しい。
Application Performance Monitoring Learning Path
APM のコースは基礎に加えてバグ診断・アラート・カスタムスパン・サンプリグの4つのコース。ラボは1つにまとめて欲しかった。
APM はトレースとメトリクスを見るよというスタンスがいい。
Diagnosting Bugs: N+1 問題の解消。Error Tracking からエラーの内容を確認して、flask のディスカウントコード確認をdiscounts = Discount.query.all() から discounts = Discount.query.options(joinedload('*')).all() に変更して、単一のクエリで行えるようにする。
Datadog が「モニター」と呼ぶものの定義。最近は推奨モニターも充実している。
Monitor: A monitor actively checks and reports on various aspects of system performance. For example, a monitor might continually check the status of web servers, database performance, or network traffic.
APM モニターは APM Metrics, Trace Analytics の2つがある。Trace Explorer の結果から Export Monitor ができる。
APM Monitor: Watchdog/APM Metric/Trace Analutics Monitor を作成する。
この表現いいね。
The ddtrace library is a powerful tool that automatically generates spans when used with ddtrace-run.
カスタムスパンタグを作ったら > ファセットやメジャーを作って > 分析する。
Custom span: tracer.wrap() デコレーターを使ってカスタムスパンとカスタムスパンタグを入れてみる。どちらかというと分析方法が学びになる。
トレースはサンプリング前提のシグナル。トレースパイプラインを理解しておこう。
ヘッドベースサンプリングは Datadog Agent/ APM SDK(Tracer) で行われる。この結果は Ingestion Control ページで確認できる。
- At the Datadog Agent level (default)
- At the Tracing Library level (overrides the Agent setup)
Log Querying & Analytics Learning Path
ログ系だけで Learning Path が2つあるのでかなり奥深い。
Log Management
Refernce Tables による Advanced Search が GA したので、かなり検索と可視化の幅は広がっている。Preview の Workspaces を使うとより柔軟に専用のビジュアルで確認できる。
Log Explorer 上で複数のクエリを同時行って可視化できるが、これはなかなか使ったことがない。Scatter Plot を作成するとデータ間の関係性が見やすい。(カート内のアイテム数と合計価格が正に相関する) Metrics と同じで関数同士で計算できるのもポイント。
サブクエリはコマンドのパイプみたいなものなので、あるクエリ結果を用いてクエリする感じ。Reference Table のラボは .csv ファイルをダウンロードして参照テーブルを作成する斬新なラボ。
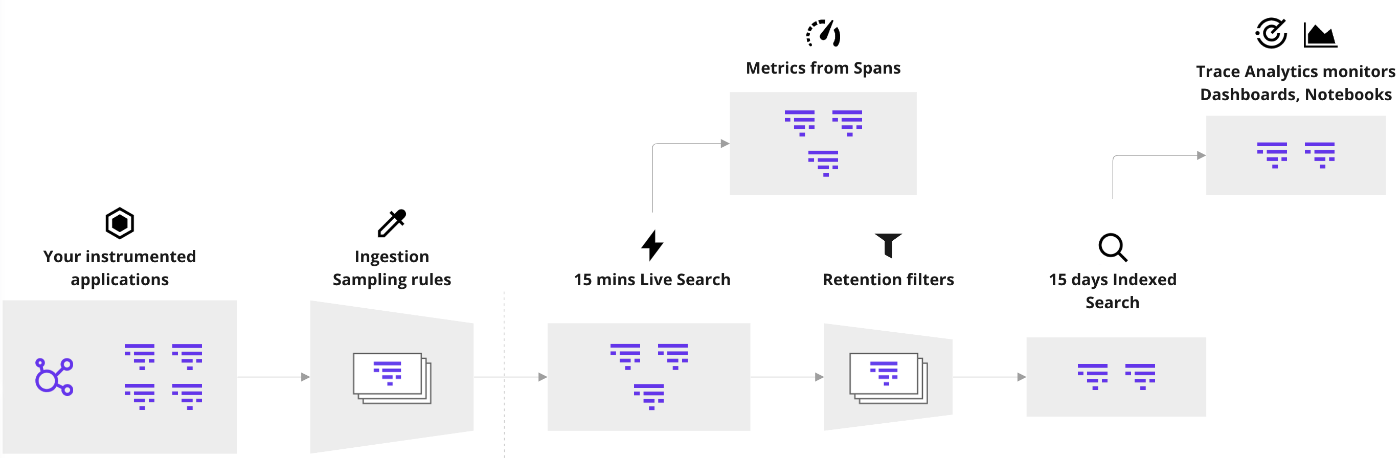
Ingest から Index の流れの図。

ログアラートは適切に変数を入れて、通知の内容を充実させたい。
{{log.attributes.key}}or of a log tag{{log.tags.key}}related to the log query. For example,{{log.attributes.[error.message]}}and{{log.tags.env}}. You can also include reserved attributes for logs with the syntax{{log.key}}. For example,{{log.service}}and{{log.status}}.
コースの要素だけでも学びがある。Log Monitor, Error Tracking, Watchdog Insights, Generate Metrics, Dashboard Reporting までをやって、ログの監視が充実する。
Log Configuration & Processing Learning Path
Log Pipeline の話は飽きるほどやっているので、あまり学ぶことはなさそう。
Log Configuration
後にも先にも Integration Pipeline がないかを探したい。Pipeline Scanner で Processor が上手くできるかをリアルタイムに試せるのは良さそう。Standard Attribute は頭に入っていないので、目を通しておきたい。
使ったことのない Processor もあるので、使い道は見ておく。
stdout, stderr は自動的に取れるよ。
Most services will write information to stdout and stderr, which are automatically collected by Datadog. However, many applications write logs across multiple files organized by time and directory.
気づいたら Multi Line Detection が新しくなっていた。
Standard Indexing vs Flex Logs はこの図だけだと説明不足なので、ログ量も考慮したい。

ログ管理のベスプラ
- When you have incredibly high volumes (millions to billions) of the same log, you don’t need to keep every single one.
- Apply sampling strategies (indexing a percentage of those logs, while excluding the rest) that ensure that you are indexing enough logs for an accurate representation of those logs.
- Not all logs are created equal.
- For example, don’t store/index your debug logs unless you believe it’s necessary to do so.
- Some logs shouldn’t be “logs.”
- For example, you can generate metrics for logs with low information density with low cardinality and sample them at a low percentage so that you can track their change over time and retain only some for investigations or audits while saving costs.
- “Don’t chase the tail”—apply the “80/20 rule” to your index optimizations and configurations
- For example, don’t chase < 1% volumes. Focus indexing strategies on logs with higher volumes.