株式会社アイデミーの土屋です。
Lab Bank という研究開発組織向けのデータ活用プラットフォームを開発しています。
はじめに
csv や Excel などの表形式のデータを加工するときに、
Python では Pandas というライブラリを使うことが多いと思います。
今回 Python で書かれた処理を TypeScript で書き直すことになり、
データフレームをいい感じに扱えるライブラリがないか探していたところ、
Danfo.js というライブラリを知りました。
実際に触ってみたところ、ほぼ Pandas と同じように扱えたため、
今回は Danfo.js の使い方について紹介したいと思います。
Danfo.js とは?
Danfo.js はオープンソースの JavaScript ライブラリで、
構造化データを操作・処理するための高性能で直感的、かつ使いやすいデータ構造を提供しています。
Danfo.js is heavily inspired by the Pandas library and provides a similar interface and API. This means users familiar with the Pandas API can easily use Danfo.js.
とある通り、
Pandas ライブラリにインスパイアされており、
locやilocなどの Pandas と同じ名前の API が多く提供されています。
また、円グラフやヒストグラムなども描画できるため、
簡単なダッシュボードの作成にも使えそうです。
インストール
Danfo.js は クライアントサイドで動く danfojsと、Node.js で動作するdanfojs-nodeの 2 つのパッケージがあります。
例ではdanfojsをインストールしていますが、
お好きな方をインストールしてください。
npm install danfojs

or

yarn add danfojs
ちなみにpnpmでも動きましたが、Vite では下記のエラーで動作しませんでした。
Failed to resolve entry for package "danfojs". The package may have incorrect main/module/exports specified in its package.json.
使い方
DataFrame の作成
import { DataFrame } from "danfojs";

const df = new DataFrame({
  a: [1, 2, 3],
  b: [4, 5, 6],
});
df.print();
# df.print()
╔════════════╤═══════════════════╤═══════════════════╗
║            │ a                 │ b                 ║
╟────────────┼───────────────────┼───────────────────╢
║ 0          │ 1                 │ 4                 ║
╟────────────┼───────────────────┼───────────────────╢
║ 1          │ 2                 │ 5                 ║
╟────────────┼───────────────────┼───────────────────╢
║ 2          │ 3                 │ 6                 ║
╚════════════╧═══════════════════╧═══════════════════╝
ラベル名で範囲指定
- 単一のラベルで指定
import { DataFrame } from "danfojs";

const df = new DataFrame({
  a: [1, 2, 3],
  b: [4, 5, 6],
});
df.print();

// カラムのラベル名で範囲指定
const colDf = df.loc({ columns: ["b"] });
colDf.print();

// 行のラベル名(≒インデックス)で範囲指定
const rowDf = df.loc({ rows: ["2"] });
rowDf.print();
# df.print();
╔════════════╤═══════════════════╤═══════════════════╗
║            │ a                 │ b                 ║
╟────────────┼───────────────────┼───────────────────╢
║ 0          │ 1                 │ 4                 ║
╟────────────┼───────────────────┼───────────────────╢
║ 1          │ 2                 │ 5                 ║
╟────────────┼───────────────────┼───────────────────╢
║ 2          │ 3                 │ 6                 ║
╚════════════╧═══════════════════╧═══════════════════╝


# colDf.print();
╔════════════╤═══════════════════╗
║            │ b                 ║
╟────────────┼───────────────────╢
║ 0          │ 4                 ║
╟────────────┼───────────────────╢
║ 1          │ 5                 ║
╟────────────┼───────────────────╢
║ 2          │ 6                 ║
╚════════════╧═══════════════════╝


# rowDf.print();
╔════════════╤═══════════════════╤═══════════════════╗
║            │ a                 │ b                 ║
╟────────────┼───────────────────┼───────────────────╢
║ 2          │ 3                 │ 6                 ║
╚════════════╧═══════════════════╧═══════════════════╝
- スライスで指定
インデックスで範囲指定
- 単一のインデックスで指定
import { DataFrame } from "danfojs";

const df = new DataFrame({
  a: [1, 2, 3],
  b: [4, 5, 6],
  c: [7, 8, 9],
});
df.print();

// カラムのインデックスで範囲指定
const colDf = df.iloc({ columns: [1] });
colDf.print();

// 行のインデックスで範囲指定
const rowDf = df.iloc({ rows: [1] });
rowDf.print();

// カラムと行のどちらも範囲指定
const bothDf = df.iloc({ rows: [1], columns: [1] });
bothDf.print();
# df.print();
╔════════════╤═══════════════════╤═══════════════════╤═══════════════════╗
║            │ a                 │ b                 │ c                 ║
╟────────────┼───────────────────┼───────────────────┼───────────────────╢
║ 0          │ 1                 │ 4                 │ 7                 ║
╟────────────┼───────────────────┼───────────────────┼───────────────────╢
║ 1          │ 2                 │ 5                 │ 8                 ║
╟────────────┼───────────────────┼───────────────────┼───────────────────╢
║ 2          │ 3                 │ 6                 │ 9                 ║
╚════════════╧═══════════════════╧═══════════════════╧═══════════════════╝

# colDf.print();
╔════════════╤═══════════════════╗
║            │ b                 ║
╟────────────┼───────────────────╢
║ 0          │ 4                 ║
╟────────────┼───────────────────╢
║ 1          │ 5                 ║
╟────────────┼───────────────────╢
║ 2          │ 6                 ║
╚════════════╧═══════════════════╝

# rowDf.print();
╔════════════╤═══════════════════╤═══════════════════╤═══════════════════╗
║            │ a                 │ b                 │ c                 ║
╟────────────┼───────────────────┼───────────────────┼───────────────────╢
║ 1          │ 2                 │ 5                 │ 8                 ║
╚════════════╧═══════════════════╧═══════════════════╧═══════════════════╝

# bothDf.print();
╔════════════╤═══════════════════╗
║            │ b                 ║
╟────────────┼───────────────────╢
║ 1          │ 5                 ║
╚════════════╧═══════════════════╝
- スライスで指定
import { DataFrame } from "danfojs";

const df = new DataFrame({
  a: [1, 2, 3],
  b: [4, 5, 6],
  c: [7, 8, 9],
});
df.print();

// カラムのインデックスをスライスで範囲指定
const colDf = df.iloc({ columns: [`0:2`] });
colDf.print();

// 行のインデックスをスライスで範囲指定
const rowDf = df.iloc({ rows: [`0:2`] });
rowDf.print();

// カラムと行のどちらもスライスで範囲指定
const bothDf = df.iloc({ rows: [`0:2`], columns: [`0:2`] });
bothDf.print();

// カラムのインデックス以降を範囲指定
const colStartDf = df.iloc({ columns: [`1:`] });
colStartDf.print();

// 行のインデックスより前を範囲指定
const rowEndDf = df.iloc({ rows: [`:1`] });
rowEndDf.print();
# df.print();
╔════════════╤═══════════════════╤═══════════════════╤═══════════════════╗
║            │ a                 │ b                 │ c                 ║
╟────────────┼───────────────────┼───────────────────┼───────────────────╢
║ 0          │ 1                 │ 4                 │ 7                 ║
╟────────────┼───────────────────┼───────────────────┼───────────────────╢
║ 1          │ 2                 │ 5                 │ 8                 ║
╟────────────┼───────────────────┼───────────────────┼───────────────────╢
║ 2          │ 3                 │ 6                 │ 9                 ║
╚════════════╧═══════════════════╧═══════════════════╧═══════════════════╝

# colDf.print();
╔════════════╤═══════════════════╤═══════════════════╗
║            │ a                 │ b                 ║
╟────────────┼───────────────────┼───────────────────╢
║ 0          │ 1                 │ 4                 ║
╟────────────┼───────────────────┼───────────────────╢
║ 1          │ 2                 │ 5                 ║
╟────────────┼───────────────────┼───────────────────╢
║ 2          │ 3                 │ 6                 ║
╚════════════╧═══════════════════╧═══════════════════╝

# rowDf.print();
╔════════════╤═══════════════════╤═══════════════════╤═══════════════════╗
║            │ a                 │ b                 │ c                 ║
╟────────────┼───────────────────┼───────────────────┼───────────────────╢
║ 0          │ 1                 │ 4                 │ 7                 ║
╟────────────┼───────────────────┼───────────────────┼───────────────────╢
║ 1          │ 2                 │ 5                 │ 8                 ║
╚════════════╧═══════════════════╧═══════════════════╧═══════════════════╝

# bothDf.print();
╔════════════╤═══════════════════╤═══════════════════╗
║            │ a                 │ b                 ║
╟────────────┼───────────────────┼───────────────────╢
║ 0          │ 1                 │ 4                 ║
╟────────────┼───────────────────┼───────────────────╢
║ 1          │ 2                 │ 5                 ║
╚════════════╧═══════════════════╧═══════════════════╝

# colStartDf.print();
╔════════════╤═══════════════════╤═══════════════════╗
║            │ b                 │ c                 ║
╟────────────┼───────────────────┼───────────────────╢
║ 0          │ 4                 │ 7                 ║
╟────────────┼───────────────────┼───────────────────╢
║ 1          │ 5                 │ 8                 ║
╟────────────┼───────────────────┼───────────────────╢
║ 2          │ 6                 │ 9                 ║
╚════════════╧═══════════════════╧═══════════════════╝

# rowEndDf.print();
╔════════════╤═══════════════════╤═══════════════════╤═══════════════════╗
║            │ a                 │ b                 │ c                 ║
╟────────────┼───────────────────┼───────────────────┼───────────────────╢
║ 0          │ 1                 │ 4                 │ 7                 ║
╚════════════╧═══════════════════╧═══════════════════╧═══════════════════╝
条件指定(クエリ)
import { DataFrame } from "danfojs";

const df = new DataFrame({
  a: [1, 2, 3],
  b: [4, 5, 6],
  c: [7, 8, 9],
});
df.print();

// 値が一致するものの条件指定
const equalDf = df.query(df["b"].eq(5));
equalDf.print();

// このように書くと、検索結果のbooleanが返却される
const booleanDf = df.eq(5);
booleanDf.print();

// 複数条件を指定する場合
const queryDf = df.query(df["b"].gt(4).and(df["c"].lt(10)));
queryDf.print();

// 下記の書き方は古いバージョンでのみ動作
// const oldDf = df.query({ column: "b", is: ">", to: 4 });
# df.print();
╔════════════╤═══════════════════╤═══════════════════╤═══════════════════╗
║            │ a                 │ b                 │ c                 ║
╟────────────┼───────────────────┼───────────────────┼───────────────────╢
║ 0          │ 1                 │ 4                 │ 7                 ║
╟────────────┼───────────────────┼───────────────────┼───────────────────╢
║ 1          │ 2                 │ 5                 │ 8                 ║
╟────────────┼───────────────────┼───────────────────┼───────────────────╢
║ 2          │ 3                 │ 6                 │ 9                 ║
╚════════════╧═══════════════════╧═══════════════════╧═══════════════════╝

# equalDf.print();
╔════════════╤═══════════════════╤═══════════════════╤═══════════════════╗
║            │ a                 │ b                 │ c                 ║
╟────────────┼───────────────────┼───────────────────┼───────────────────╢
║ 1          │ 2                 │ 5                 │ 8                 ║
╚════════════╧═══════════════════╧═══════════════════╧═══════════════════╝


# booleanDf.print();
╔════════════╤═══════════════════╤═══════════════════╤═══════════════════╗
║            │ a                 │ b                 │ c                 ║
╟────────────┼───────────────────┼───────────────────┼───────────────────╢
║ 0          │ false             │ false             │ false             ║
╟────────────┼───────────────────┼───────────────────┼───────────────────╢
║ 1          │ false             │ true              │ false             ║
╟────────────┼───────────────────┼───────────────────┼───────────────────╢
║ 2          │ false             │ false             │ false             ║
╚════════════╧═══════════════════╧═══════════════════╧═══════════════════╝

# queryDf.print();
╔════════════╤═══════════════════╤═══════════════════╤═══════════════════╗
║            │ a                 │ b                 │ c                 ║
╟────────────┼───────────────────┼───────────────────┼───────────────────╢
║ 1          │ 2                 │ 5                 │ 8                 ║
╟────────────┼───────────────────┼───────────────────┼───────────────────╢
║ 2          │ 3                 │ 6                 │ 9                 ║
╚════════════╧═══════════════════╧═══════════════════╧═══════════════════╝
値の計算
import { DataFrame } from "danfojs";

const df = new DataFrame({
  a: [1, 2, 3],
  b: [4, 5, 6],
  c: [7, 8, 9],
});
df.print();

// 各カラムごとの合計値
const sumDf = df.sum();
sumDf.print();

// 各カラムごとの平均値
const meanDf = df.mean();
meanDf.print();

// 各セルの値に加算
const addDf = df.add(3);
addDf.print();
# df.print();
╔════════════╤═══════════════════╤═══════════════════╤═══════════════════╗
║            │ a                 │ b                 │ c                 ║
╟────────────┼───────────────────┼───────────────────┼───────────────────╢
║ 0          │ 1                 │ 4                 │ 7                 ║
╟────────────┼───────────────────┼───────────────────┼───────────────────╢
║ 1          │ 2                 │ 5                 │ 8                 ║
╟────────────┼───────────────────┼───────────────────┼───────────────────╢
║ 2          │ 3                 │ 6                 │ 9                 ║
╚════════════╧═══════════════════╧═══════════════════╧═══════════════════╝

# sumDf.print();
╔═══╤════╗
║ 0 │ 12 ║
╟───┼────╢
║ 1 │ 15 ║
╟───┼────╢
║ 2 │ 18 ║
╚═══╧════╝

# meanDf.print();
╔═══╤═══╗
║ 0 │ 4 ║
╟───┼───╢
║ 1 │ 5 ║
╟───┼───╢
║ 2 │ 6 ║
╚═══╧═══╝


# addDf.print();
╔════════════╤═══════════════════╤═══════════════════╤═══════════════════╗
║            │ a                 │ b                 │ c                 ║
╟────────────┼───────────────────┼───────────────────┼───────────────────╢
║ 0          │ 4                 │ 7                 │ 10                ║
╟────────────┼───────────────────┼───────────────────┼───────────────────╢
║ 1          │ 5                 │ 8                 │ 11                ║
╟────────────┼───────────────────┼───────────────────┼───────────────────╢
║ 2          │ 6                 │ 9                 │ 12                ║
╚════════════╧═══════════════════╧═══════════════════╧═══════════════════╝
関数の適用
import { DataFrame } from "danfojs";

const df = new DataFrame({
  a: [1, 2, 3],
  b: [4, 5, 6],
  c: [7, 8, 9],
});
df.print();

function sum_vals(col: number[]) {
  return col.reduce((a, b) => a + b, 0);
}

// DataFrameに対して関数を適用する
// 各行の値の合計
const rowSumDf = df.apply(sum_vals, { axis: 1 });
rowSumDf.print();

// 各カラムの値の合計
const colSumDf = df.apply(sum_vals, { axis: 0 });
colSumDf.print();
# df.print();
╔════════════╤═══════════════════╤═══════════════════╤═══════════════════╗
║            │ a                 │ b                 │ c                 ║
╟────────────┼───────────────────┼───────────────────┼───────────────────╢
║ 0          │ 1                 │ 4                 │ 7                 ║
╟────────────┼───────────────────┼───────────────────┼───────────────────╢
║ 1          │ 2                 │ 5                 │ 8                 ║
╟────────────┼───────────────────┼───────────────────┼───────────────────╢
║ 2          │ 3                 │ 6                 │ 9                 ║
╚════════════╧═══════════════════╧═══════════════════╧═══════════════════╝

# rowSumDf.print();
╔═══╤════╗
║ 0 │ 12 ║
╟───┼────╢
║ 1 │ 15 ║
╟───┼────╢
║ 2 │ 18 ║
╚═══╧════╝

# colSumDf.print();
╔═══╤════╗
║ a │ 6  ║
╟───┼────╢
║ b │ 15 ║
╟───┼────╢
║ c │ 24 ║
╚═══╧════╝
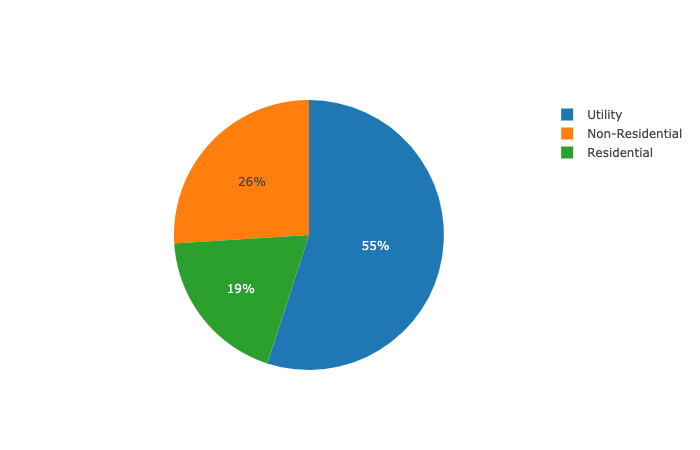
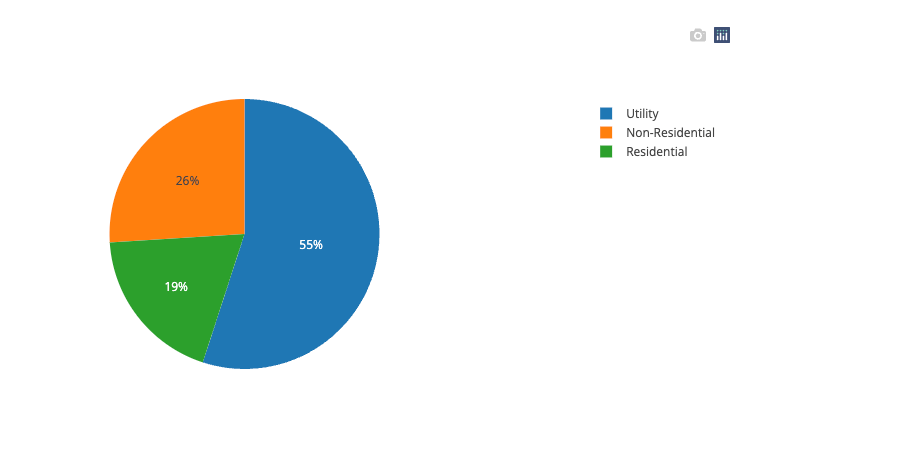
円グラフの描画
import { useEffect } from "react";
import { DataFrame } from "danfojs";

const Pie = () => {
  useEffect(() => {
    const df = new DataFrame({
      Price: [19, 26, 55],
      Type: ["Residential", "Non-Residential", "Utility"],
    });

    // idを指定して描画
    df.plot("plot_div").pie({ config: { values: "Price", labels: "Type" } });
  }, []);

  return <div id="plot_div" className=""></div>;
};
デフォルトでグラフのダウンロードもついてました
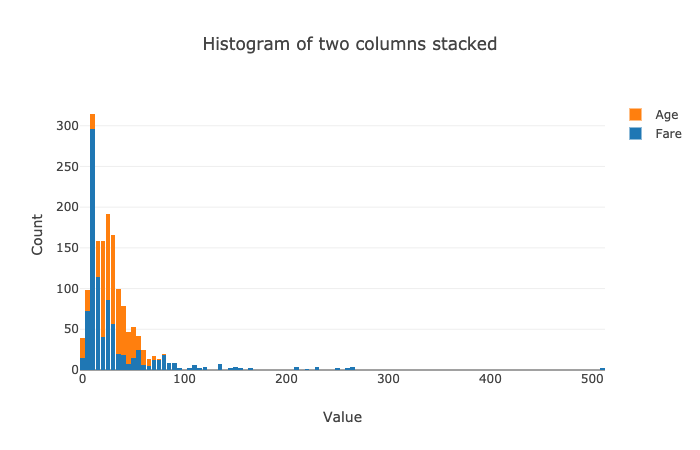
ヒストグラムの描画
import { useEffect } from "react";
import { readCSV } from "danfojs";

const Histogram = () => {
  useEffect(() => {
    readCSV(
      "https://raw.githubusercontent.com/pandas-dev/pandas/master/doc/data/titanic.csv"
    )
      .then((df) => {
        const layout = {
          bargap: 0,
          bargroupgap: 0.1,
          title: "Histogram of two columns stacked",
          xaxis: { title: "Value" },
          yaxis: { title: "Count" },
        };

        const sub_df = df.loc({ columns: ["Fare", "Age"] });
        sub_df.plot("plot_div").hist({ layout });
      })
      .catch((err) => {
        console.log(err);
      });
  }, []);

  return <div id="plot_div"></div>;
};

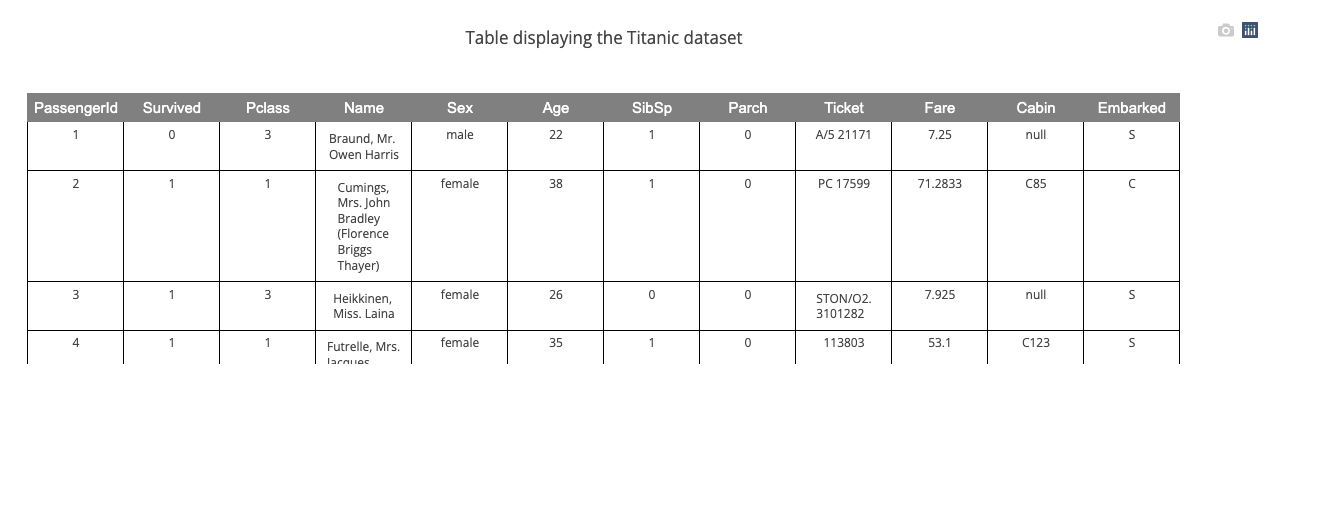
Table への描画
import { useEffect } from "react";
import { readCSV } from "danfojs";

const Table = () => {
  useEffect(() => {
    readCSV(
      "https://raw.githubusercontent.com/pandas-dev/pandas/master/doc/data/titanic.csv"
    )
      .then((df) => {
        const headerStyle = {
          align: "center",
          fill: { color: ["gray"] },
          font: { family: "Arial", size: 15, color: "white" },
        };
        const cellStyle = {
          align: ["center"],
          line: { color: "black", width: 1 },
        };

        df.plot("plot_div").table({
          config: {
            tableHeaderStyle: headerStyle,
            tableCellStyle: cellStyle,
          },
          layout: {
            title: "Table displaying the Titanic dataset",
          },
        });
      })
      .catch((err) => {
        console.log(err);
      });
  }, []);

  return <div id="plot_div"></div>;
};
まとめ
Pandas のように手軽にデータフレームを扱えるライブラリとして、
Danfo.js をご紹介しました。
React でデータ加工や可視化が行えるのは便利ですね。
ドキュメントの記載が古いためか、ちょくちょくコンパイルエラーに遭遇しましたが、
そこまでコード量は多くないため、実装を見に行ってしまうのが早いかもしれません。
アイデミーでは一緒に働く仲間を募集中です!!

Discussion