はじめに
組織でSVツリー(上司部下の関係がわかるようなツリー)をつくって、それをもとに1on1などを実施していき、ピープルケアに役立てよう!ということでパワポで下記のようなツリーをつくりました。
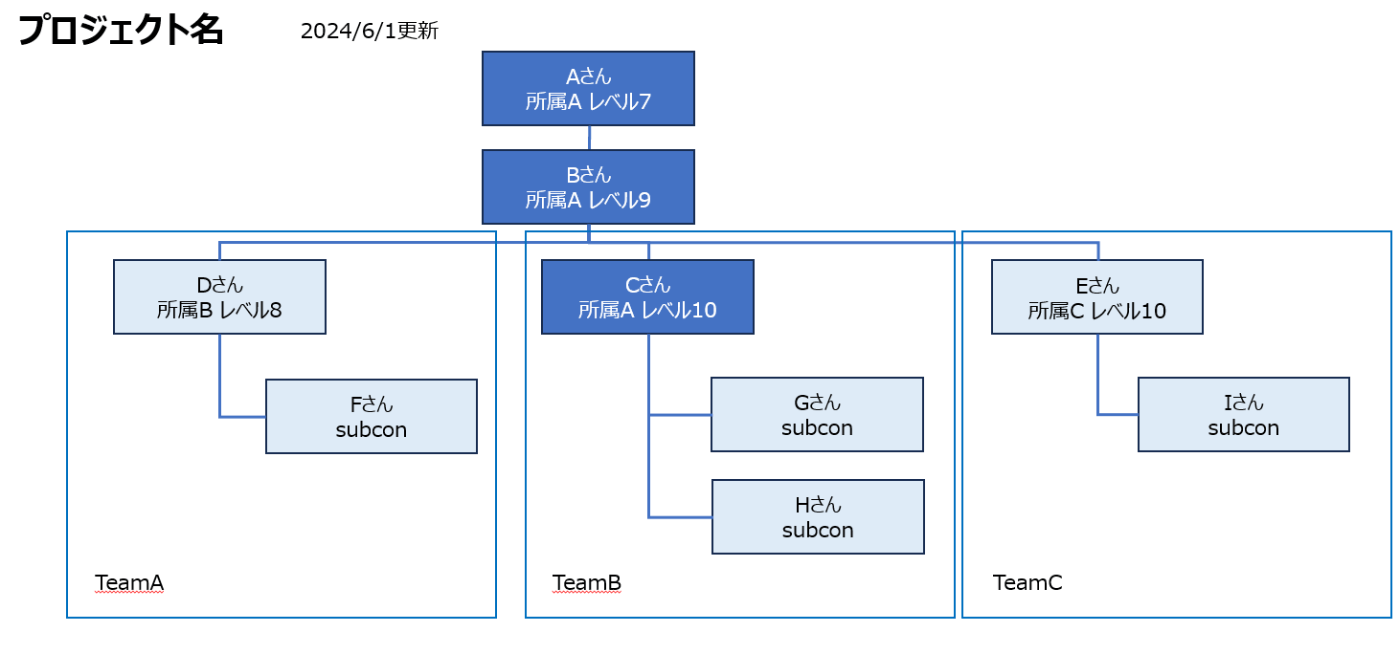
これを各プロジェクトで作ってもらって運用していこうと思った矢先・・・
「パワポ更新するのつらい」との声がでて・・何とか他の方法で出来ないかと考えてGPTに相談しながらExcelから自動でSVツリーを生成するソリューションをつくりました。
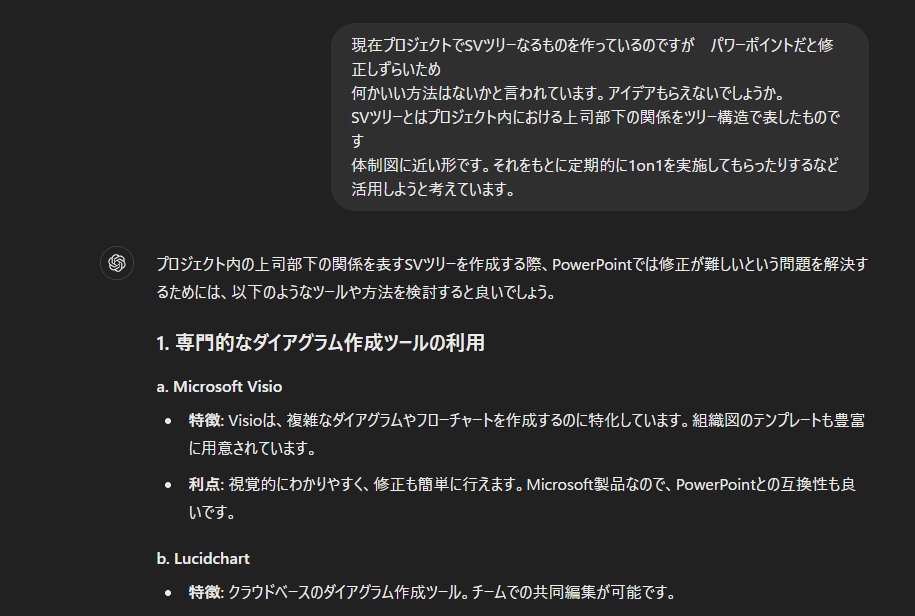
結果、Pythonと描画ツールであるGraphvizを組み合わせて作成することができました。
SVツリーの作成手順
手順 1: Excelファイルの準備
-
Excelファイルを作成:
- 以下のような形式でデータを入力します。
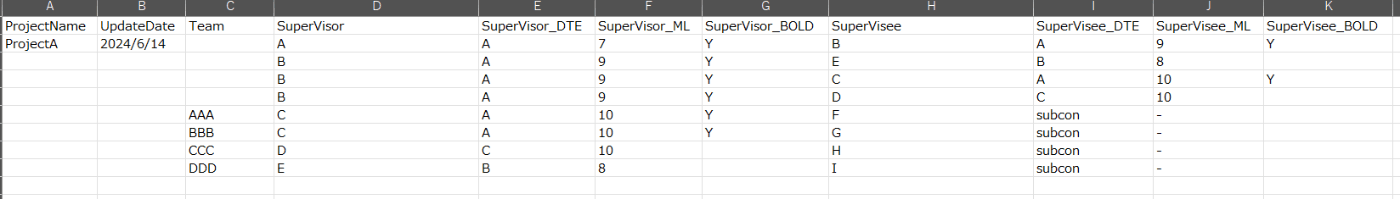
- 以下のような形式でデータを入力します。
手順 2: Pythonスクリプトの作成
-
Pythonスクリプトを作成※修正後のスクリプトは記事の下部に記載※:
- 以下のスクリプトをテキストエディタにコピーし、
convert_and_generate_tree.pyという名前で保存します。
import pandas as pd from graphviz import Digraph # Excelファイルを読み込む excel_file = 'sv_relations.xlsx' df = pd.read_excel(excel_file) # プロジェクト名と更新日を取得 project_name = df['ProjectName'].iloc[0] update_date = df['UpdateDate'].iloc[0] # CSVファイルとして保存 csv_file = 'sv_relations.csv' df.to_csv(csv_file, index=False) # Graphvizの有向グラフを作成 dot = Digraph() # グラフ全体のラベルとしてプロジェクト名と更新日を追加 dot.attr(label=f'{project_name}\nUpdate Date: {update_date}', labelloc='t', labeljust='l', fontsize='20') # 各行を読み込んでノードとエッジを追加 for index, row in df.iterrows(): superVisor = row['SuperVisor'] superVisor_dte = row['SuperVisor_DTE'] superVisor_ml = str(row['SuperVisor_ML']) # 文字列に変換 superVisor_tgu = row['SuperVisor_TGU'] if pd.notna(row['SuperVisor_TGU']) else '' # SuperVisorのTGUの値を取得、ない場合は空文字列にする superVisee = row['SuperVisee'] superVisee_dte = row['SuperVisee_DTE'] superVisee_ml = str(row['SuperVisee_ML']) # 文字列に変換 superVisee_tgu = row['SuperVisee_TGU'] if pd.notna(row['SuperVisee_TGU']) else '' # SuperViseeのTGUの値を取得、ない場合は空文字列にする # SuperVisorとSuperViseeのTGUの値を見て、太枠にするかどうかを判断 if superVisor_tgu and not superVisee_tgu: # SuperVisorのみに存在し、SuperViseeに存在しない場合 dot.node(superVisor, label=f"{superVisor}\nDTE: {superVisor_dte}\nML: {superVisor_ml}", shape='box', penwidth='2', width='2.0', height='0.7') dot.node(superVisee, label=f"{superVisee}\nDTE: {superVisee_dte}\nML: {superVisee_ml}", shape='box', width='2.0', height='0.7') elif not superVisor_tgu and superVisee_tgu: # SuperViseeのみに存在し、SuperVisorに存在しない場合 dot.node(superVisor, label=f"{superVisor}\nDTE: {superVisor_dte}\nML: {superVisor_ml}", shape='box', width='2.0', height='0.7') dot.node(superVisee, label=f"{superVisee}\nDTE: {superVisee_dte}\nML: {superVisee_ml}", shape='box', penwidth='2', width='2.0', height='0.7') elif superVisor_tgu and superVisee_tgu: # SuperVisorとSuperVisee両方に存在する場合 dot.node(superVisor, label=f"{superVisor}\nDTE: {superVisor_dte}\nML: {superVisor_ml}", shape='box', penwidth='2', width='2.0', height='0.7') dot.node(superVisee, label=f"{superVisee}\nDTE: {superVisee_dte}\nML: {superVisee_ml}", shape='box', penwidth='2', width='2.0', height='0.7') else: # どちらも存在しない場合 dot.node(superVisor, label=f"{superVisor}\nDTE: {superVisor_dte}\nML: {superVisor_ml}", shape='box', width='2.0', height='0.7') dot.node(superVisee, label=f"{superVisee}\nDTE: {superVisee_dte}\nML: {superVisee_ml}", shape='box', width='2.0', height='0.7') # エッジを追加 dot.edge(superVisor, superVisee) # DOTファイルとして保存 dot.render('sv_tree', format='png') print("ツリー図を生成しました: sv_tree.png") - 以下のスクリプトをテキストエディタにコピーし、
手順 3: 必要なツールのインストール
-
Pythonをインストール(まだインストールしていない場合):
- Pythonの公式サイトからPythonをダウンロードし、インストールします。
- インストール時に「Add Python to PATH」にチェックを入れてください。
-
必要なライブラリをインストール:
- コマンドプロンプトを開き、以下のコマンドを実行して必要なPythonライブラリをインストールします。
pip install pandas graphviz
3.Graphvizをインストール:
Graphvizの公式サイトからGraphvizをダウンロードし、インストールします。
インストール後、Graphvizのbinディレクトリ(通常は C:\Program Files\Graphviz\bin)をシステムのPATHに追加します。
PATHにGraphvizのbinディレクトリを追加する方法
Windowsの場合
- スタートメニューを開き、「環境変数」と検索し、「システム環境変数の編集」を選択します。
- 「環境変数」ボタンをクリックします。
- 「システム環境変数」の一覧から「Path」を選択し、「編集」ボタンをクリックします。
- 「新規」ボタンをクリックし、Graphvizのbinディレクトリのパス(例:
C:\Program Files\Graphviz\bin)を追加します。 - 「OK」ボタンをクリックしてすべてのダイアログを閉じます。
手順 4: Pythonスクリプトの実行
-
Pythonスクリプトを実行:
- コマンドプロンプトを開き、スクリプトの保存場所に移動します。
cd path\to\your\script
- スクリプトを実行します。
python convert_and_generate_tree.py
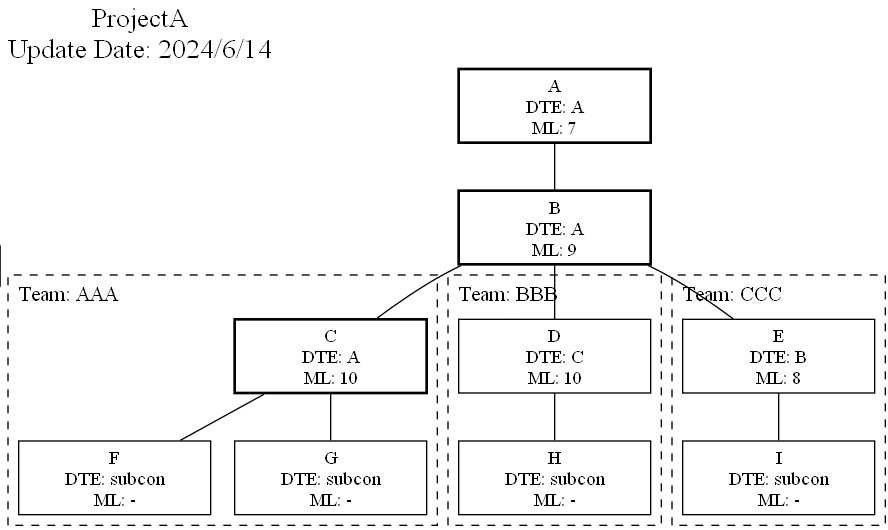
結果
スクリプトの実行が完了すると、(インプットファイル名).png という名前のツリー図の画像ファイルが生成されます。
追記
- インプットのフォルダに複数ファイルを格納して一括で処理できるように変更しました。
- プロジェクト内のチームを表現できるように変更しました。
- 実行時にインプットフォルダとアウトプットフォルダを選択するようにしました。
- ノード間の線の重複を削除
修正後のPythonスクリプト
import pandas as pd
from graphviz import Digraph
import os
from tkinter import Tk, filedialog

# Tkinterのルートウィンドウを非表示にする
root = Tk()
root.withdraw()

# インプットフォルダの選択ダイアログを表示
input_folder_path = filedialog.askdirectory(title='インプットフォルダを選択してください')
if not input_folder_path:
    print("インプットフォルダが選択されませんでした。スクリプトを終了します。")
    exit()

# アウトプットフォルダの選択ダイアログを表示
output_folder_path = filedialog.askdirectory(title='アウトプットフォルダを選択してください')
if not output_folder_path:
    print("アウトプットフォルダが選択されませんでした。スクリプトを終了します。")
    exit()

# フォルダ内のすべてのExcelファイルを取得
excel_files = [f for f in os.listdir(input_folder_path) if f.endswith('.xlsx')]

def format_ml(value):
    try:
        return str(int(float(value)))
    except (ValueError, TypeError):
        return str(value)

# 各Excelファイルについて処理を行う
for excel_file in excel_files:
    file_path = os.path.join(input_folder_path, excel_file)
    df = pd.read_excel(file_path)

    # プロジェクト名と更新日を取得
    project_name = df['ProjectName'].iloc[0]
    update_date = df['UpdateDate'].iloc[0]

    # Graphvizの有向グラフを作成
    dot = Digraph(strict=True)

    # グラフ全体のラベルとしてプロジェクト名と更新日を追加
    dot.attr(label=f'{project_name}\nUpdate Date: {update_date}', labelloc='t', labeljust='l', fontsize='20')

    # エッジの重複を防ぐためにセットを使用
    added_edges = set()

    # チームごとにサブグラフを作成してノードを追加
    for team in df['Team'].astype(str).unique():
        with dot.subgraph(name=f'cluster_{team}') as c:
            c.attr(style='dashed', color='black', label=f'Team: {team}', fontsize='16', labelloc='t', labeljust='l')
            team_rows = df[df['Team'] == team]
            for index, row in team_rows.iterrows():
                superVisor = row['SuperVisor']
                superVisor_dte = row['SuperVisor_DTE']
                superVisor_ml = format_ml(row['SuperVisor_ML'])  # 文字列に変換
                superVisor_bold = row['SuperVisor_BOLD'] if pd.notna(row['SuperVisor_BOLD']) else ''  # SuperVisorのBOLDの値を取得、ない場合は空文字列にする
                superVisee = row['SuperVisee']
                superVisee_dte = row['SuperVisee_DTE']
                superVisee_ml = format_ml(row['SuperVisee_ML'])  # 文字列に変換
                superVisee_bold = row['SuperVisee_BOLD'] if pd.notna(row['SuperVisee_BOLD']) else ''  # SuperViseeのBOLDの値を取得、ない場合は空文字列にする

                # SuperVisorとSuperViseeのBOLDの値を見て、太枠にするかどうかを判断
                if superVisor_bold and not superVisee_bold:  # SuperVisorのみに存在し、SuperViseeに存在しない場合
                    c.node(superVisor, label=f"{superVisor}\nDTE: {superVisor_dte}\nML: {superVisor_ml}", shape='box', penwidth='2', width='2.0', height='0.7')
                    c.node(superVisee, label=f"{superVisee}\nDTE: {superVisee_dte}\nML: {superVisee_ml}", shape='box', width='2.0', height='0.7')
                elif not superVisor_bold and superVisee_bold:  # SuperViseeのみに存在し、SuperVisorに存在しない場合
                    c.node(superVisor, label=f"{superVisor}\nDTE: {superVisor_dte}\nML: {superVisor_ml}", shape='box', width='2.0', height='0.7')
                    c.node(superVisee, label=f"{superVisee}\nDTE: {superVisee_dte}\nML: {superVisor_ml}", shape='box', penwidth='2', width='2.0', height='0.7')
                elif superVisor_bold and superVisee_bold:  # SuperVisorとSuperVisee両方に存在する場合
                    c.node(superVisor, label=f"{superVisor}\nDTE: {superVisor_dte}\nML: {superVisor_ml}", shape='box', penwidth='2', width='2.0', height='0.7')
                    c.node(superVisee, label=f"{superVisee}\nDTE: {superVisee_dte}\nML: {superVisee_ml}", shape='box', penwidth='2', width='2.0', height='0.7')
                else:  # どちらも存在しない場合
                    c.node(superVisor, label=f"{superVisor}\nDTE: {superVisor_dte}\nML: {superVisor_ml}", shape='box', width='2.0', height='0.7')
                    c.node(superVisee, label=f"{superVisee}\nDTE: {superVisee_dte}\nML: {superVisee_ml}", shape='box', width='2.0', height='0.7')

                # エッジを追加(矢印なし)
                if (superVisor, superVisee) not in added_edges:
                    dot.edge(superVisor, superVisee, arrowhead='none')
                    added_edges.add((superVisor, superVisee))

    # すべてのノードを追加
    for index, row in df.iterrows():
        superVisor = row['SuperVisor']
        superVisor_dte = row['SuperVisor_DTE']
        superVisor_ml = format_ml(row['SuperVisor_ML'])  # 文字列に変換
        superVisor_bold = row['SuperVisor_BOLD'] if pd.notna(row['SuperVisor_BOLD']) else ''  # SuperVisorのBOLDの値を取得、ない場合は空文字列にする
        superVisee = row['SuperVisee']
        superVisee_dte = row['SuperVisee_DTE']
        superVisee_ml = format_ml(row['SuperVisee_ML'])  # 文字列に変換
        superVisee_bold = row['SuperVisee_BOLD'] if pd.notna(row['SuperVisee_BOLD']) else ''  # SuperViseeのBOLDの値を取得、ない場合は空文字列にする

        # SuperVisorとSuperViseeのBOLDの値を見て、太枠にするかどうかを判断
        if superVisor_bold and not superVisee_bold:  # SuperVisorのみに存在し、SuperViseeに存在しない場合
            dot.node(superVisor, label=f"{superVisor}\nDTE: {superVisor_dte}\nML: {superVisor_ml}", shape='box', penwidth='2', width='2.0', height='0.7')
            dot.node(superVisee, label=f"{superVisee}\nDTE: {superVisee_dte}\nML: {superVisee_ml}", shape='box', width='2.0', height='0.7')
        elif not superVisor_bold and superVisee_bold:  # SuperViseeのみに存在し、SuperVisorに存在しない場合
            dot.node(superVisor, label=f"{superVisor}\nDTE: {superVisor_dte}\nML: {superVisor_ml}", shape='box', width='2.0', height='0.7')
            dot.node(superVisee, label=f"{superVisee}\nDTE: {superVisee_dte}\nML: {superVisee_ml}", shape='box', penwidth='2', width='2.0', height='0.7')
        elif superVisor_bold and superVisee_bold:  # SuperVisorとSuperVisee両方に存在する場合
            dot.node(superVisor, label=f"{superVisor}\nDTE: {superVisor_dte}\nML: {superVisor_ml}", shape='box', penwidth='2', width='2.0', height='0.7')
            dot.node(superVisee, label=f"{superVisee}\nDTE: {superVisee_dte}\nML: {superVisee_ml}", shape='box', penwidth='2', width='2.0', height='0.7')
        else:  # どちらも存在しない場合
            dot.node(superVisor, label=f"{superVisor}\nDTE: {superVisor_dte}\nML: {superVisor_ml}", shape='box', width='2.0', height='0.7')
            dot.node(superVisee, label=f"{superVisee}\nDTE: {superVisee_dte}\nML: {superVisee_ml}", shape='box', width='2.0', height='0.7')

        # エッジを追加(矢印なし)
        if (superVisor, superVisee) not in added_edges:
            dot.edge(superVisor, superVisee, arrowhead='none')
            added_edges.add((superVisor, superVisee))

    # DOTファイルとして保存
    output_filename = os.path.splitext(excel_file)[0]  # 元のファイル名をベースにする
    output_path = os.path.join(output_folder_path, output_filename)
    dot.render(output_path, format='png')

    print(f"ツリー図を生成しました: {output_filename}.png")

アクセンチュア株式会社に所属する社員有志による運営です。アクセンチュアの社員による様々な発信をまとめています。なお、投稿内容は社員個人の見解であり、所属する組織を代表するものではありません。
Discussion