📚
中心極限定理を確かめてみる

中心極限定理とは
次の母集団から5個抽出することを10000回やりヒストグラム、平均、分散を求めます。
5652 2187 592 265 13 435 3842 31323 4 500 3842 31323 4 500 352 7 229 284 4 613 883 1556 90 16440 774 2164 776 155 330 10867 4913 2178 16 6488
ソースコード
using Plots
using StatsBase

x = [5652 2187 592 265 13 435 3842 31323 4 500 3842 31323 4 500 352 7 229 284 4 613 883 1556 90 16440 774 2164 776 155 330 10867 4913 2178 16 6488]

sample_means = Int64[]

for i ∈ 1:10000
    push!(sample_means, rand(x, 5) |> mean |> x -> round(Int, x, RoundNearestTiesUp))
end


histogram(
    sample_means,
    title="central limit theorem", label="", xlabel="sample mean", ylabel="frequency",
    linecolor="#624498", linewidth=2, fillalpha=0.2,
    xlims=(0, maximum(sample_means))
    )

savefig("central_limit_theorem.png")

@show mean(x), var(x)
@show mean(sample_means), var(sample_means)
@show mean(x), var(x) / 5
ヒストグラム
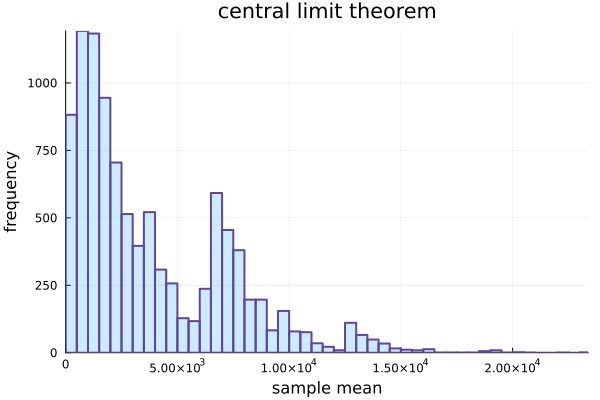
代表値
母集団、標本、中心極限定理での推定値の平均と分散を示します。
| 集団種別 | 平均 | 分散 |
|---|---|---|
| 母集団 | 3812 | 6.08 |
| 標本 | 3880 | 1.19 |
| 中心極限定理での推定値 | 3812 | 1.215 |
Discussion