🐙
正規分布に従っていない母集団の標本平均のヒストグラムについて

中心極限定理とは、抽出元の母集団が正規分布に従っていない場合でも標本平均は正規分布に従うという定理です。今回は実データを元に標本平均が正規分布に従うかヒストグラムを表示します。
標本数が69、標本サイズが5、10000回抽出した標本平均の分布を求めました。
ソースコード
using Plots
using StatsBase

x = [
    49599, 38582, 56619, 48610, 50834, 49428,
    68770, 59745, 72272, 77897,
    93871, 74859, 77991, 49253,
    53963, 67515, 77303, 91320,
    51489, 74508, 74791, 74093, 61799,
    64005, 67184, 60391, 84259,
    49561, 59995, 68221, 68529, 58643,
    66884, 55623, 54172, 78562,
    74743, 65134, 40621, 58612,
    55680, 130, 48498, 59923, 68183,
    68846, 55422, 65982, 64023,
    53697, 42026, 57606, 38105,
    52178, 56547, 52425, 59105, 48454,
    52307, 77960, 42576, 78761,
    29045, 35459, 30606, 29814,
    39134, 18660, 47804
]

sample_means = Int64[]

for i ∈ 1:10000
    push!(sample_means, rand(x, 5) |> mean |> x -> round(Int, x, RoundNearestTiesUp))
end


histogram(sample_means, label="sample mean", lc="#624498", fa=0.2)

savefig("steps_count.png")

@show skewness(sample_means), kurtosis(sample_means)
結果
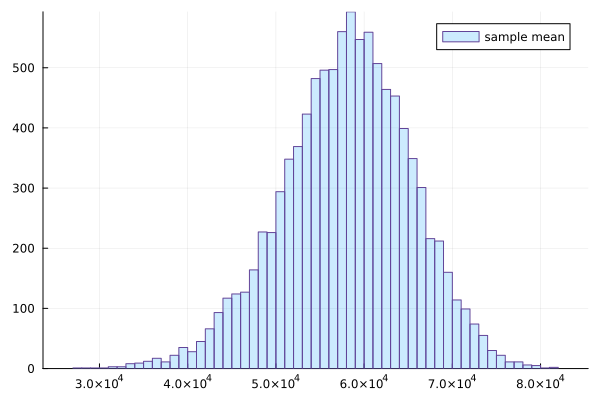
歪度が-0.25864088696738335なので左裾の方向に伸びていて、尖度が0.1736032761595947なので尖っているようです。
Discussion