Stock Price Prediction Using Informer And Alpha Vantage API


Stock price prediction using Informer and Alpha Vantage API
A memo on stock price prediction using the Informer algorithm, an improvement on the Transformer algorithm used in ChatGPT, for time series data.
I am not responsible if you lose money using this!
The code in this article is an arrangement of the Github Repository published by Haoyi Zhou, the first author of the Informer paper:
What is Informer?
A paper that won the AAAI2021 Best Paper award.
By replacing the Self-attention mechanism of Transformer with the ProbSparse self-attention mechanism using probabilistic sparsification, the computational complexity is reduced.
As a result, when dealing with long-term time series data, relatively high accuracy can be achieved with a smaller amount of computation using Informer.
Implementation
Follow these steps:
- Initial settings
- Obtain stock price data
- Set hyperparameters
- Train
- Predict
- Evaluate
Environment: Google Colab Pro version with a normal GPU (device = cuda) tested on 2023/03/26.
Initial settings
Install the necessary libraries and clone the repository:
!pip install yfinance
!git clone https://github.com/zhouhaoyi/Informer2020.git
!ls

import os
import sys
if not 'Informer2020' in sys.path:
    sys.path += ['Informer2020']

from utils.tools import dotdict
from exp.exp_informer import Exp_Informer
import torch

from torch.utils.data import DataLoader
from data.data_loader import Dataset_Pred
from torch.utils.data import DataLoader
import pandas as pd
import numpy as np
import yfinance as yf
import requests
import json
import time
Obtain stock price data
Obtain stock price data for training and prediction.
Since Yahoo! Finance only provides data at 1-hour intervals at the shortest, we use the Alpha Vantage API, which allows us to obtain data at the minute level for free.
In this code, we obtain OHLCV data for Apple for the past two years at 15-minute intervals.
Get a free API from the Alpha Vantage site (the free version has a 5 requests/min limit).
def get_stock_data(symbol, interval, api_key, slice):
    url = f"https://www.alphavantage.co/query?function=TIME_SERIES_INTRADAY_EXTENDED&symbol={symbol}&interval={interval}&slice={slice}&apikey={api_key}"
    response = requests.get(url)

    if response.status_code == 200:
        data = response.text.splitlines()
        return data
    else:
        print(f"Error {response.status_code}: Failed to fetch data.")
        return None

def convert_to_dataframe(raw_data):
    header = raw_data[0].split(',')
    data_rows = [row.split(',') for row in raw_data[1:]]

    df = pd.DataFrame(data_rows, columns=header)
    df['time'] = pd.to_datetime(df['time'])
    df[['open', 'high', 'low', 'close', 'volume']] = df[['open', 'high', 'low', 'close', 'volume']].apply(pd.to_numeric)

    df.sort_values(by='time', ascending=True, inplace=True)
    df.reset_index(drop=True, inplace=True)

    return df

def get_full_data(symbol, interval, api_key):
    slices = [f"year1month{i}" for i in range(1, 13)] + [f"year2month{i}" for i in range(1, 13)]

    all_data = []
    for slice in slices:
        raw_stock_data = get_stock_data(symbol, interval, api_key, slice)
        if raw_stock_data:
            all_data.extend(raw_stock_data[1:])
        time.sleep(15)  #wait

    all_data.insert(0, raw_stock_data[0])
    stock_dataframe = convert_to_dataframe(all_data)

    return stock_dataframe

symbol = "AAPL" #Ticker
interval = "15min"  #Interval
api_key = "YOUR_API_KEY"  #Enter your API key obtained from Alpha Vantage here.

stock_dataframe = get_full_data(symbol, interval, api_key)
stock_dataframe.rename(columns={'time': 'date'}, inplace=True)
stock_dataframe.head()
df = stock_dataframe

output_directory = '/content/'
csv_filename = "output.csv"
output_path = os.path.join(output_directory, csv_filename)
df.to_csv(output_path, index=True)
df.head()
Hyperparameter Settings
Perform encoding on the close (closing price) using the OHLCV features every 15 minutes, and as an example, make predictions for 3 business days later. The conditions for this part are extracted from the following code.
args.target = "close"
args.freq = '15m'
args.features = 'MS'
args.pred_len = 84 # =4*7*3
Set train parameters
args = dotdict()

args.model = 'informer' # model of experiment, options: [informer, informerstack, informerlight(TBD)]

args.data = 'custom' # data
args.root_path = '/content/' # root path of data file
args.data_path = 'output.csv' # data file
args.features = 'MS' # forecasting task, options:[M, S, MS];
                    #M:multivariate predict multivariate, S:univariate predict univariate,
                    #MS:multivariate predict univariate
args.target = 'close' # target feature in S or MS task
args.freq = '15m' # freq for time features encoding, options:[s:secondly, t:minutely, h:hourly, d:daily, b:business days, w:weekly, m:monthly], you can also use more detailed freq like 15min or 3h
args.checkpoints = './informer_checkpoints' # location of model checkpoints

args.seq_len = 96 # input sequence length of Informer encoder
args.label_len = 48 # start token length of Informer decoder
args.pred_len = 84 # prediction sequence length
# Informer decoder input: concat[start token series(label_len), zero padding series(pred_len)]

args.enc_in = 8 # encoder input size
args.dec_in = 8 # decoder input size
args.c_out = 8 # output size
args.factor = 5 # probsparse attn factor
args.d_model = 512 # dimension of model
args.n_heads = 8 # num of heads
args.e_layers = 2 # num of encoder layers
args.d_layers = 1 # num of decoder layers
args.d_ff = 2048 # dimension of fcn in model
args.dropout = 0.05 # dropout
args.attn = 'prob' # attention used in encoder, options:[prob, full]
args.embed = 'timeF' # time features encoding, options:[timeF, fixed, learned]
args.activation = 'gelu' # activation
args.distil = True # whether to use distilling in encoder
args.output_attention = False # whether to output attention in ecoder
args.mix = True
args.padding = 0
args.freq = 'h'

args.batch_size = 32
args.learning_rate = 0.0001
args.loss = 'mse'
args.lradj = 'type1'
args.use_amp = False # whether to use automatic mixed precision training

args.num_workers = 0
args.itr = 1
args.train_epochs = 20
args.patience = 3
args.des = 'exp'

args.use_gpu = True if torch.cuda.is_available() else False
args.gpu = 0

args.use_multi_gpu = False
args.devices = '0,1,2,3'
Setting GPU
args.use_gpu = True if torch.cuda.is_available() and args.use_gpu else False

if args.use_gpu and args.use_multi_gpu:
    args.devices = args.devices.replace(' ','')
    device_ids = args.devices.split(',')
    args.device_ids = [int(id_) for id_ in device_ids]
    args.gpu = args.device_ids[0]
# Set augments by using data name
data_parser = {
    'custom':{'data':'output.csv','T':'close','M':[6,6,6],'S':[1,1,1],'MS':[6,6,1]}, #Change the array here based on the number of features
}
if args.data in data_parser.keys():
    data_info = data_parser[args.data]
    args.data_path = data_info['data']
    args.target = data_info['T']
    args.enc_in, args.dec_in, args.c_out = data_info[args.features]

args.detail_freq = args.freq
args.freq = args.freq[-1:]

Exp = Exp_Informer
print('Args in experiment:')
print(args)
Train Model
for ii in range(args.itr):
    # setting record of experiments
    setting = '{}_{}_ft{}_sl{}_ll{}_pl{}_dm{}_nh{}_el{}_dl{}_df{}_at{}_fc{}_eb{}_dt{}_mx{}_{}_{}'.format(args.model, args.data, args.features,
                args.seq_len, args.label_len, args.pred_len,
                args.d_model, args.n_heads, args.e_layers, args.d_layers, args.d_ff, args.attn, args.factor, args.embed, args.distil, args.mix, args.des, ii)

    # set experiments
    exp = Exp(args)

    # train
    print('>>>>>>>start training : {}>>>>>>>>>>>>>>>>>>>>>>>>>>'.format(setting))
    exp.train(setting)

    # test
    print('>>>>>>>testing : {}<<<<<<<<<<<<<<<<<<<<<<<<<<<<<<<<<'.format(setting))
    exp.test(setting)

    torch.cuda.empty_cache()

mse:0.042731158435344696, mae:0.15262167155742645となった
Prediction
# set saved model path
setting = 'informer_custom_ftMS_sl96_ll48_pl84_dm512_nh8_el2_dl1_df2048_atprob_fc5_ebtimeF_dtTrue_mxTrue_exp_0'
# path = os.path.join(args.checkpoints,setting,'checkpoint.pth')


# If you already have a trained model, you can set the arguments and model path, then initialize a Experiment and use it to predict
# Prediction is a sequence which is adjacent to the last date of the data, and does not exist in the data
# If you want to get more information about prediction, you can refer to code `exp/exp_informer.py function predict()` and `data/data_loader.py class Dataset_Pred`

exp = Exp(args)

exp.predict(setting, True)

prediction = np.load('./results/'+setting+'/real_prediction.npy')

prediction.shape

Data = Dataset_Pred
timeenc = 0 if args.embed!='timeF' else 1
flag = 'pred'; shuffle_flag = False; drop_last = False; batch_size = 1

freq = args.detail_freq

data_set = Data(
    root_path=args.root_path,
    data_path=args.data_path,
    flag=flag,
    size=[args.seq_len, args.label_len, args.pred_len],
    features=args.features,
    target=args.target,
    timeenc=timeenc,
    freq=freq
)
data_loader = DataLoader(
    data_set,
    batch_size=batch_size,
    shuffle=shuffle_flag,
    num_workers=args.num_workers,
    drop_last=drop_last)

len(data_set), len(data_loader)
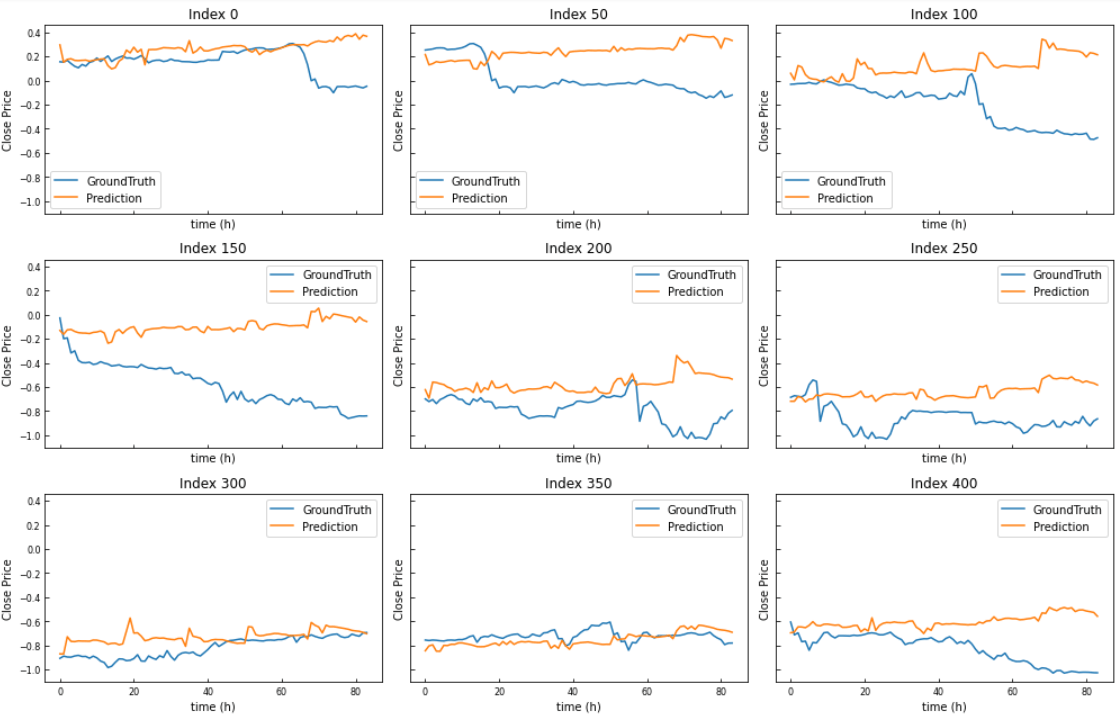
Validation,Visualization
# When we finished exp.train(setting) and exp.test(setting), we will get a trained model and the results of test experiment
# The results of test experiment will be saved in ./results/{setting}/pred.npy (prediction of test dataset) and ./results/{setting}/true.npy (groundtruth of test dataset)

preds = np.load('./results/'+setting+'/pred.npy')
trues = np.load('./results/'+setting+'/true.npy')

# [samples, pred_len, dimensions]
preds.shape, trues.shape
import matplotlib.pyplot as plt

def plot_predictions(trues, preds, start_index, step, num_plots):
    num_rows = num_plots // 3
    num_cols = 3

    fig, axes = plt.subplots(num_rows, num_cols, figsize=(14, 3 * num_rows), sharex=True, sharey=True)

    for i, ax in enumerate(axes.flatten()):
        if i < num_plots:
            index = start_index + i * step

            ax.plot(trues[index, :, -1], label='GroundTruth')
            ax.plot(preds[index, :, -1], label='Prediction')

            ax.set_title(f'Index {index}')
            ax.legend()
            ax.set_xlabel('time (h)')
            ax.set_ylabel('Close Price')
            ax.tick_params(axis='both', which='both', labelsize=8, direction='in')

        else:
            ax.axis('off')


    plt.tight_layout()
    plt.show()
plot_predictions(trues, preds, start_index=0, step=50, num_plots=9)
End
Discussion