
はじめに
この記事では Node.js アプリケーションを OpenTelemetry を使って計装し、 API リクエストのトレーシングを試してみます。
アプリケーションは大きく三つのレイヤーに分かれている API サービスです。
- Router
- Usecase
- DB Access
リクエストからレスポンスまでの間、それぞれのレイヤーでどれだけ処理時間がかかっているのか確認できる状態を目指していきます。
OpenTelemetry とは
OpenTelemetry(以下 OTel )はメトリクスやログ、トレースのようなテレメトリデータを計測するためのツールセットです。マイクロサービス構成のようなシステムが分散した環境で、リクエストを一貫してトレースする分散トレーシングの用途で使われることが多いです。
OTel はマイクロサービスの文脈でよく登場しますがマイクロサービスでなくても導入する効果があります。
アプリケーションの構成
- Node.js
- Express
- Prisma
Express でリクエストを受けて Prisma で DB からデータを取ってきて JSON で返す API サービスです。
// index.ts

import express from "express";
import { todoRouter } from "./router/todo";

const app = express();
app.use(express.json());

app.use("/todo", todoRouter);

const PORT = parseInt(process.env.PORT || "8080");
app.listen(PORT, () => {
  console.log(`Listening for requests on http://localhost:${PORT}`);
});
// router/todo.ts

import { Router } from "express";
import { listTodo } from "../usecase/todo";

export const todoRouter = Router();

todoRouter.get("/", async (req, res) => {
  const data = await listTodo();
  res.json({ data });
});
// usecase/todo.ts

import { Todo } from "@prisma/client";
import { prisma } from "../db";

export async function listTodo(): Todo[] {
  return await prisma.todo.findMany();
}
API を叩くと JSON が返ってきます。
$ curl http://localhost:8080/todo | jq
{
  "data": [
    {
      "id": 1,
      "title": "book flight to Tokyo",
      "description": "due date is this weekend.",
      "done": true
    },
    {
      "id": 2,
      "title": "write blog post",
      "description": null,
      "done": false
    }
  ]
}
実装
OpenTelemetry を導入する
ここから OTel を導入していきます。
必要なモジュールをインストールします。
npm install \
    @opentelemetry/api \
    @opentelemetry/auto-instrumentations-node \
    @opentelemetry/sdk-node
OTel をセットアップするコードを実装します。
// otel/instrumentation.ts

import { getNodeAutoInstrumentations } from "@opentelemetry/auto-instrumentations-node";
import { Resource } from "@opentelemetry/resources";
import { NodeSDK } from "@opentelemetry/sdk-node";
import { ConsoleSpanExporter } from "@opentelemetry/sdk-trace-base";
import { SemanticResourceAttributes } from "@opentelemetry/semantic-conventions";

const resource = new Resource({
  [SemanticResourceAttributes.SERVICE_NAME]: "backend-service",
});

// トレースをコンソールに表示するためのExporter
const traceExporter = new ConsoleSpanExporter();

const instrumentations = [
  getNodeAutoInstrumentations({
    // 今回はノイズになるので fs 関連の計測を切っておく
    "@opentelemetry/instrumentation-fs": { enabled: false },
    // Express 関連の自動計測を有効化する
    "@opentelemetry/instrumentation-express": { enabled: true },
  }),
];

const sdk = new NodeSDK({
  resource,
  traceExporter,
  instrumentations,
});

// 計測を開始する
sdk.start();
このファイルを Express が起動する前に読み込むようにします。
npx tsx --require ./otel/instrumentation.ts index.ts
これで準備ができました。
サーバーを起動して API を叩くと以下のようなテレメトリがコンソールに表示されるようになりました。
{
  traceId: '49f66767cbebe166d78accab0ee92425',
  parentId: undefined,
  traceState: undefined,
  name: 'GET /todo',
  id: 'cb3958ca310f1d9f',
  kind: 1,
  timestamp: 1701855629617000,
  duration: 73389.583,
  attributes: {
    'http.url': 'http://localhost:8080/todo',
    'http.host': 'localhost:8080',
    'net.host.name': 'localhost',
    'http.method': 'GET',
    'http.scheme': 'http',
    'http.target': '/todo',
    'http.user_agent': 'curl/8.1.2',
    'http.flavor': '1.1',
    'net.transport': 'ip_tcp',
    'net.host.ip': '::ffff:127.0.0.1',
    'net.host.port': 8080,
    'net.peer.ip': '::ffff:127.0.0.1',
    'net.peer.port': 53941,
    'http.status_code': 200,
    'http.status_text': 'OK',
    'http.route': '/todo'
  },
  status: { code: 0 },
  events: [],
  links: []
}
ただこのような JSON のテレメトリがコンソールに表示されるだけだと解析が難しいですね。
なので OTel のバックエンドへテレメトリを送るようにしてトレースを可視化をしてみましょう。
Jaeger で可視化する
今回は Jaeger という OSS の分散トレーシングプラットフォームを使います。
このページを参考にトレースを Jaeger へ送るようにセットアップします。
npm install @opentelemetry/exporter-trace-otlp-proto
  // otel/instrumentation.ts

  import { getNodeAutoInstrumentations } from "@opentelemetry/auto-instrumentations-node";
  import { Resource } from "@opentelemetry/resources";
  import { NodeSDK } from "@opentelemetry/sdk-node";
- import { ConsoleSpanExporter } from "@opentelemetry/sdk-trace-base";
+ import { OTLPTraceExporter } from "@opentelemetry/exporter-trace-otlp-proto";
  import { SemanticResourceAttributes } from "@opentelemetry/semantic-conventions";

  const resource = new Resource({
    [SemanticResourceAttributes.SERVICE_NAME]: "backend-service",
  });

- const traceExporter = new ConsoleSpanExporter();
+ const traceExporter = new OTLPTraceExporter();

  const instrumentations = [
    getNodeAutoInstrumentations({
      "@opentelemetry/instrumentation-fs": { enabled: false },
      "@opentelemetry/instrumentation-express": { enabled: true },
    }),
  ];

  const sdk = new NodeSDK({
    resource,
    traceExporter,
    instrumentations,
  });

  sdk.start();
Docker を使ってローカル上に Jaeger を立ち上げます。
docker run --rm \
  -e COLLECTOR_ZIPKIN_HOST_PORT=:9411 \
  -p 16686:16686 \
  -p 4317:4317 \
  -p 4318:4318 \
  -p 9411:9411 \
  jaegertracing/all-in-one:latest
起動したらブラウザで UI へアクセスしてみましょう。
open http://localhost:16686

起動が確認できました。
サーバーを起動して API を叩いたあとで Find Traces を実行します。


トレースを可視化できました。
Express の自動計測を有効にしているので middleware や router のデータが取れています。
ただ、Express のトレース情報だけでは処理の大半で何が行われているのか分かりません。
なので次は Usecase の処理のトレースを取れるようにします。
手動でテレメトリを収集する
このページを参考に手動でテレメトリを収集するコードを実装します。
  // usecase/todo.ts

+ import { Span, trace } from "@opentelemetry/api";
  import { Todo } from "@prisma/client";
  import { prisma } from "../db";

+ const tracer = trace.getTracer("usecase");

-  export async function listTodo(): Todo[] {
-    return await prisma.todo.findMany();
-  }
+ export async function listTodo(): Promise<Todo[]> {
+   return tracer.startActiveSpan("usecase:listTodo", async (span: Span) => {
+     const result = await await prisma.todo.findMany();
+
+     span.setAttribute("todo.count", result.length);
+     span.end();
+     return result;
+   });
+ }
セットアップが終わったら API を叩いて Jaeger を確認します。

Usecase 層の処理時間が見えるようになりました。
この API の処理時間の大半は Usecase 層に費やされているようです。
Usecase では Prisma を使ってデータベースへアクセスしています。
次はデータベースアクセスを計測することで処理時間の内訳を分析してみましょう。
Prisma のテレメトリを収集する
Prisma の OpenTelemetry tracing 機能を使ってデータベースへのアクセスを計測します。
(執筆時点では Prisma の tracing は Preview 機能です)
このページを参考にセットアップしていきます。
npm install @prisma/instrumentation
  // otel/instrumentation.ts

  import { getNodeAutoInstrumentations } from "@opentelemetry/auto-instrumentations-node";
  import { OTLPTraceExporter } from "@opentelemetry/exporter-trace-otlp-proto";
  import { Resource } from "@opentelemetry/resources";
  import { NodeSDK } from "@opentelemetry/sdk-node";
  import { SemanticResourceAttributes } from "@opentelemetry/semantic-conventions";
+ import { PrismaInstrumentation } from "@prisma/instrumentation";

  const resource = new Resource({
    [SemanticResourceAttributes.SERVICE_NAME]: "backend-service",
    [SemanticResourceAttributes.SERVICE_VERSION]: "1.0.0",
    [SemanticResourceAttributes.SERVICE_INSTANCE_ID]: "instance-1",
  });

  const traceExporter = new OTLPTraceExporter();

  const instrumentations = [
    getNodeAutoInstrumentations({
      "@opentelemetry/instrumentation-fs": { enabled: false },
      "@opentelemetry/instrumentation-express": { enabled: true },
    }),
+   new PrismaInstrumentation(),
  ];

  const sdk = new NodeSDK({
    resource,
    traceExporter,
    instrumentations,
  });

  sdk.start();
  // prisma/schema.prisma

  generator client {
    provider        = "prisma-client-js"
+   previewFeatures = ["tracing"]
  }

  datasource db {
    provider = "postgresql"
    url      = env("DATABASE_URL")
  }

  model Todo {
    id          Int     @id @default(autoincrement())
    title       String
    description String?
    done        Boolean @default(false)
  }
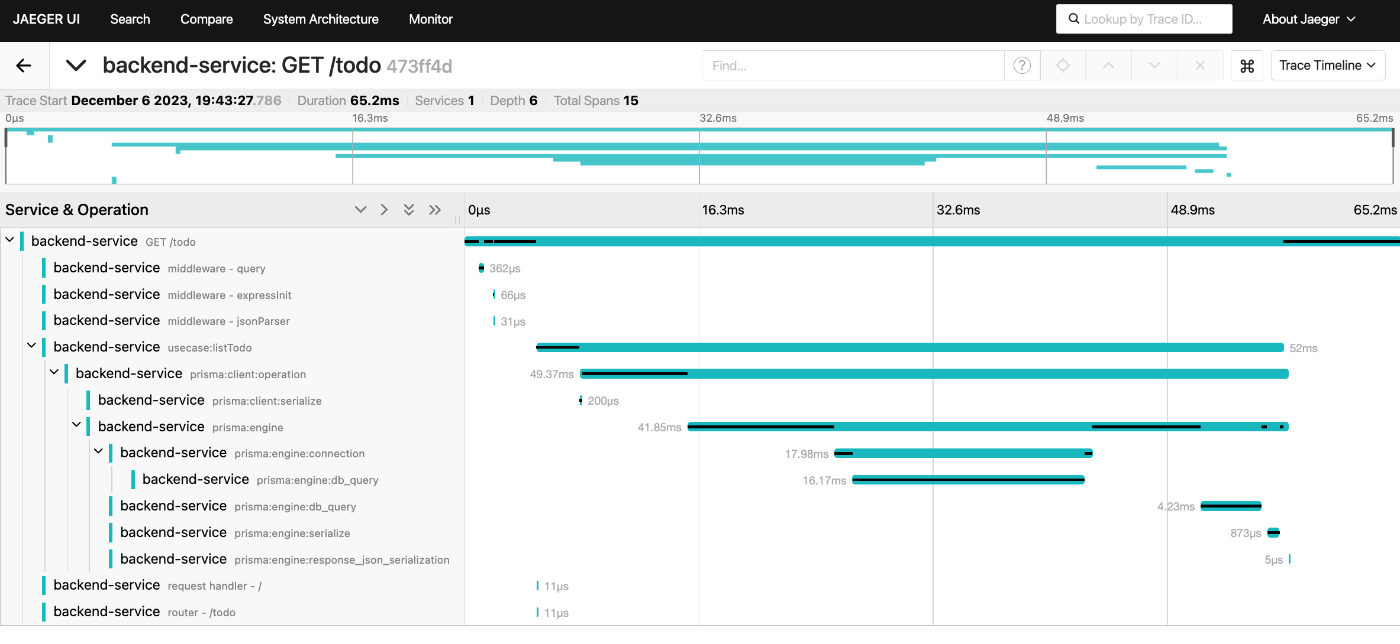
セットアップが終わったら API を叩いて Jaeger を確認します。

Prisma の処理時間が可視化されました。
どうやら Usecase の処理の大半は DB への接続(prisma:client:connection)に費やされていたようです。
これはサーバー起動後、初回の DB アクセスになっているからと思われます。2回目のアクセスであればプールされたコネクションが利用されるので DB 接続は発生しないはずです。
サーバーを起動したままもう一度 API を叩いてトレースを見てみます。
2 回目のアクセスでは DB 接続処理 (prisma:client:connection) は実行されませんでした。
このように OTel と Jaeger を活用すると内部の処理時間やフローを可視化して分析できるようになります。
おわりに
OTel はマイクロサービスの分散トレーシングだけでなくモノリス構成のトレーシングにも活用できます。
実際に運用環境へ適用する場合はテレメトリのサンプリングや計測箇所、メトリクスの設計、チームの事情に合った OTel バックエンドの選定など他にも考慮ポイントがいくつもあったりします。
ですがローカル開発からでも導入を始められます。できるところから計測処理を仕込んでおいて、その後の状況に合わせて徐々にカスタマイズしていくことを検討してみてはいかがでしょうか。
参考リンク

ちょっと株式会社(chot-inc.com)のエンジニアブログです。 フロントエンドエンジニア募集中! カジュアル面接申し込みはこちらから chot-inc.com/recruit/iuj62owig
Discussion