📝
Golangで重み付き乱択アルゴリズムを作成したので検証してみる


インターンで作成したガチャのアルゴリズムが果たして正しいのか検証してみる。
アルゴリズムについて
以下の記事を参考にコーディングしました。
ループを用いて重み付き抽選を行う
正直自分が解説するよりわかりやすいので気になる方は記事を見てみてください。
以下がGoのコードになります。(ちょっとだけコメント入れました)
細かいほかの部分のコードはちょっと見せれないです。
// getGacha ガチャアルゴリズム
func getGacha(times int, allcollection []entity.RatioCollection) []entity.RatioCollection {
	var results []entity.RatioCollection
	var totalRatio int
	// 重みの合計を取得
	for _, value := range allcollection {
		totalRatio += value.Ratio
	}
	// ランダム生成
	seed := time.Now().UnixNano()
	r := rand.New(rand.NewSource(seed))
	// ランダム生成された数字を超えたものをスライスに突っ込む
	for i := 0; i < times; i++ {
		val := r.Intn(totalRatio)
		var currentRatio int
		for _, value := range allcollection {
			currentRatio += value.Ratio
			if currentRatio > val {
				results = append(results, value)
				break
			}
		}
	}
	return results
}
このコードが果たして正しいのか。
重み付き乱択というものを作成したことがなかったので気になり検証してみます。
検証はPythonで行います。(普段触っているため。)
ヘッダーなど関係ない部分を一部を隠しています。
コード
import requests
import json
from collections import defaultdict
import matplotlib.pyplot as plt

# ガチャを引く部分
def draw_gacha():
    url = "http://localhost:8080/gacha/draw"
    payload = {"times": 10}
    headers = {'Content-Type': 'application/json'}

    response = requests.post(url, json=payload, headers=headers)

    if response.status_code == 200:
        return json.loads(response.text)["results"]
    else:
        print(f"ガチャ失敗: {response.status_code}")
        return None

# 各アイテムが何回出たかを集計
def collect_statistics(num_trials):
    counts = defaultdict(int)

    for _ in range(num_trials):
        results = draw_gacha()
        if results is not None:
            for result in results:
                collectionID = result["collectionID"]
                counts[collectionID] += 1

    return counts

# アイテムが出る確率を計算
def calculate_probabilities(counts, num_trials):
    total_draws = sum(counts.values())
    probabilities = {}

    for collectionID, count in counts.items():
        probabilities[collectionID] = count / total_draws

    return probabilities

# グラフにプロット
def plot_probabilities(probabilities):
    sorted_keys = sorted(probabilities.keys())
    sorted_probs = [probabilities[k] for k in sorted_keys]

    plt.figure(figsize=(20, 10))
    plt.bar(sorted_keys, sorted_probs)
    plt.xlabel('Collection ID')
    plt.ylabel('Probability')
    plt.title('Gacha Probabilities')
    plt.xticks(rotation=90)
    plt.show()

if __name__ == "__main__":
    num_trials = 10000  # 試行回数
    counts = collect_statistics(num_trials)
    probabilities = calculate_probabilities(counts, num_trials)

    print("Sorted Probabilities:")
    for collectionID, prob in sorted(probabilities.items()):
        print(f"{collectionID}: {prob}")

    plot_probabilities(probabilities)
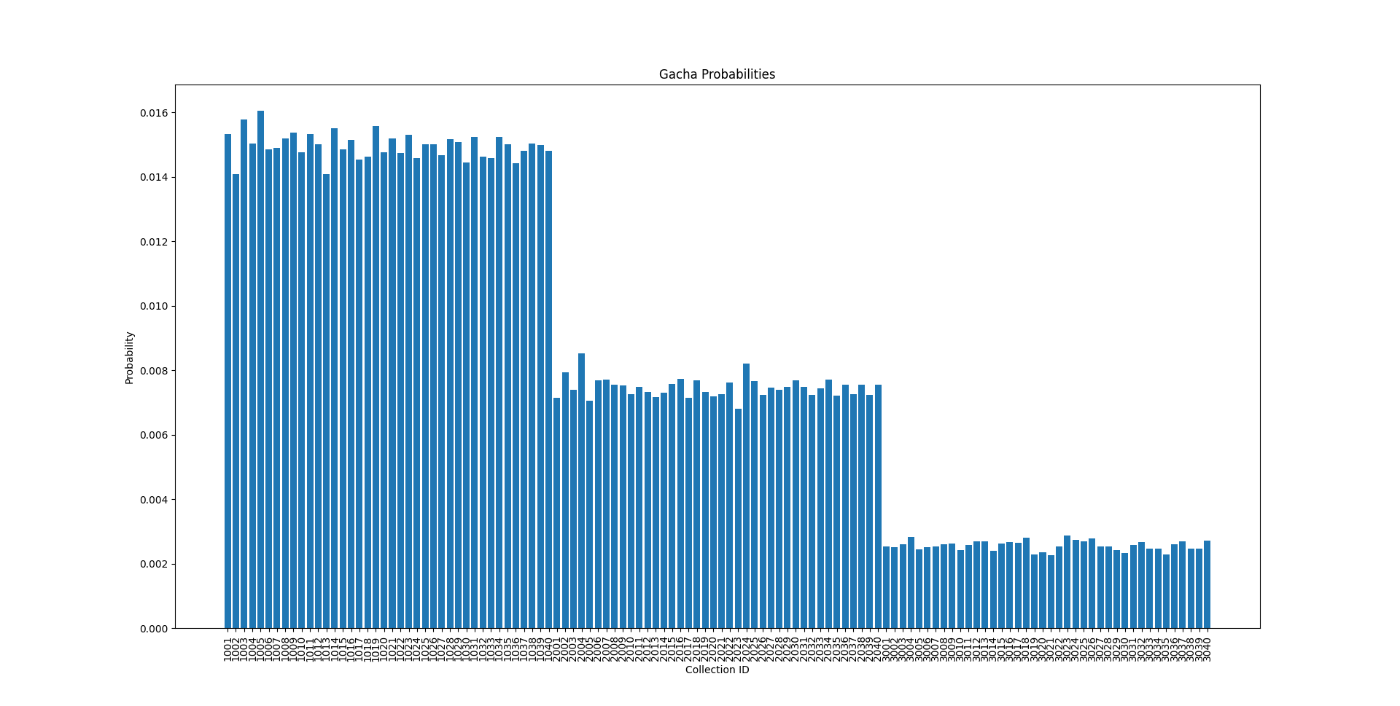
結果
10万回引かせてみました。結果は期待通りになりました。
検証データ
1001~1040までのアイテムが40個あり、それぞれの重みが6
2001~2040までのアイテムが40個あり、それぞれの重みが3
3001~3040までのアイテムが40個あり、それぞれの重みが1
これを合計すると、240 + 120 + 40 = 400となります。
各アイテムの期待値(確率)を計算すると以下になります。
1001~1040までのアイテム(重み6)の期待値は 6 / 400 = 0.015
2001~2040までのアイテム(重み3)の期待値は 3 / 400 = 0.0075
3001~3040までのアイテム(重み1)の期待値は 1 / 400 = 0.0025
検証結果
以下が結果です。
10万回の結果なので期待値付近に収束しています。
Discussion